

Introducing Plugixa Activity Log 1.0.0: See Who Did What on WordPress

Meet Plugixa Activity Log, version 1.0.0. It records what happens on your WordPress site and lets you find it again in seconds: every sign-in, failed sign-in, new account, role change, published post, deleted page, uploaded file, moderated comment, activated plugin and changed setting, with who did it, when, from which IP address and what changed.
What it does
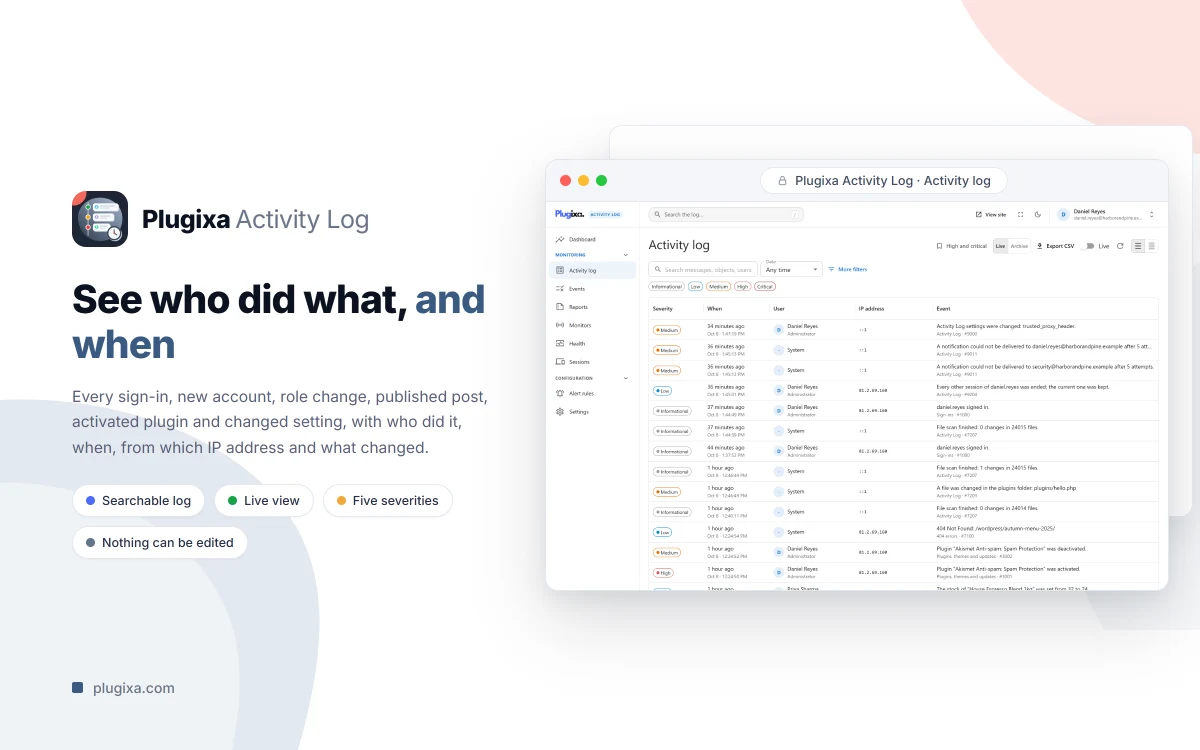
The log is a fast screen you can search, not a table of raw rows. Type a word to search the whole history, then narrow by date, severity, user, role, IP address or event code, and save the combination as a view. Switch on the live view and new events appear as they happen.
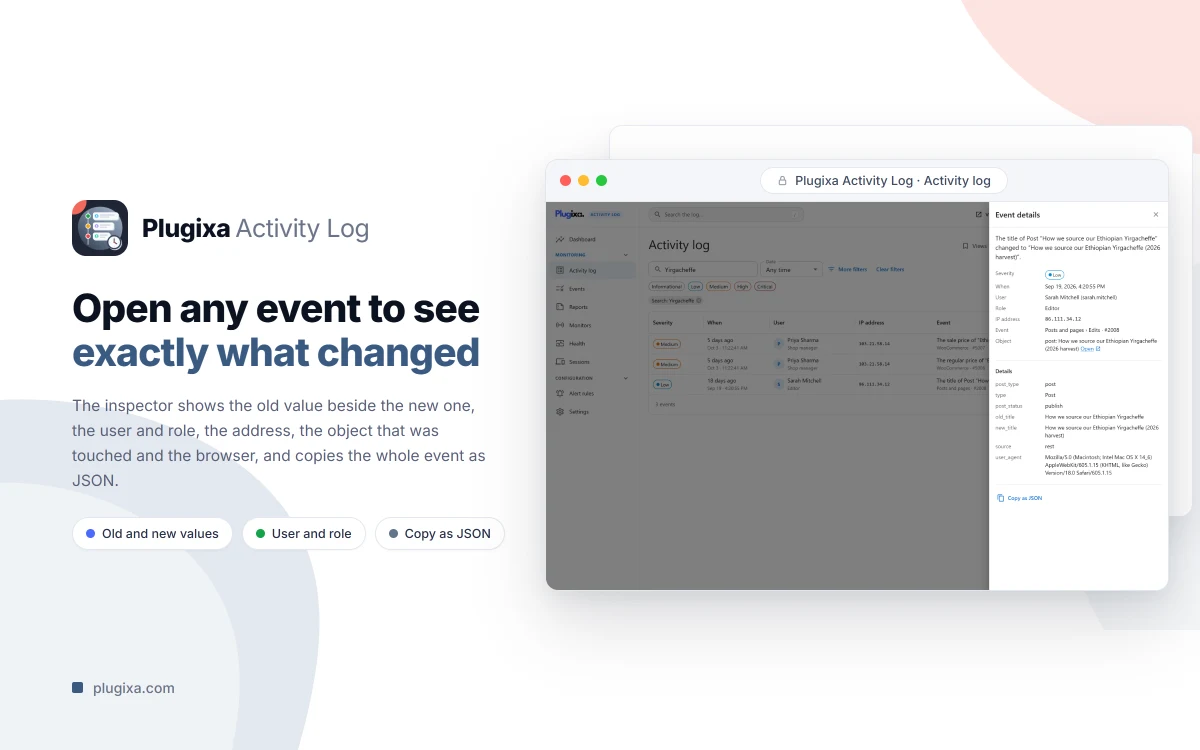
Open any event and the inspector shows the old value beside the new one. No screen and no REST route edits or deletes an event, so the record stays a record.
Highlights
- A searchable log with full-text search, combinable filters, a live view and an event inspector.
- Monitors you switch on or off for sign-ins, user accounts, content, media, comments, menus and widgets, plugins and themes, and settings. A monitor that is off attaches nothing.
- Per-event switches and exclusions by user, role, IP address or range, and post type.
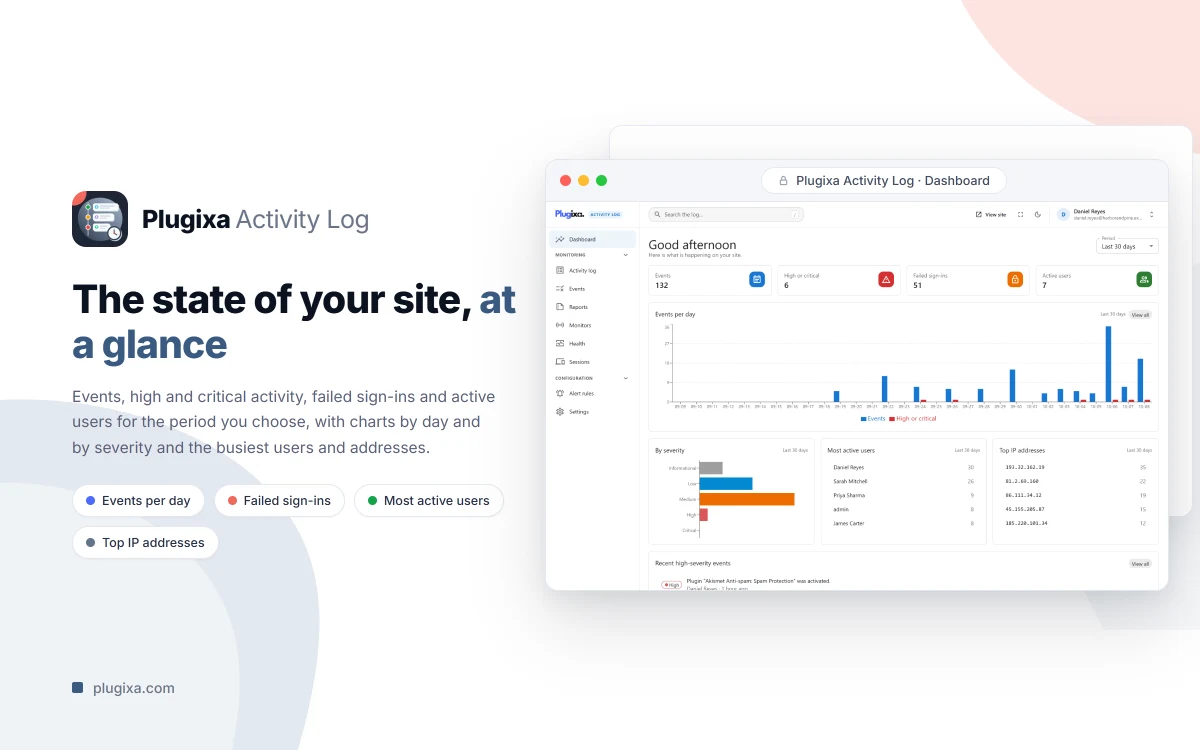
- A dashboard of events, failed sign-ins, active users and the busiest addresses, plus a Recent activity panel on the WordPress dashboard.
- Saved views, personal or shared, with a default.
- Email notifications with a severity threshold, a digest and an hourly cap.
- Retention by age and by number of events, and a flood of failed sign-ins summarised into one event.
- Privacy tools: IP addresses stored in full, shortened or not at all, and support for WordPress’s own export and erase requests.
- WP-CLI and a REST API, a Health screen, and an importer for WP Activity Log history.
- Multisite: one network log, with site administrators seeing their own site.
Built for a large log
Events are kept in one indexed table of their own, lists page by key rather than by offset, and each request writes its events once, at the end. Old events are removed in small slices by a daily job, so retention never holds up a visitor.
Free and Pro
Everything above is in the free plugin. Nothing in it is time-limited or switched off pending payment.
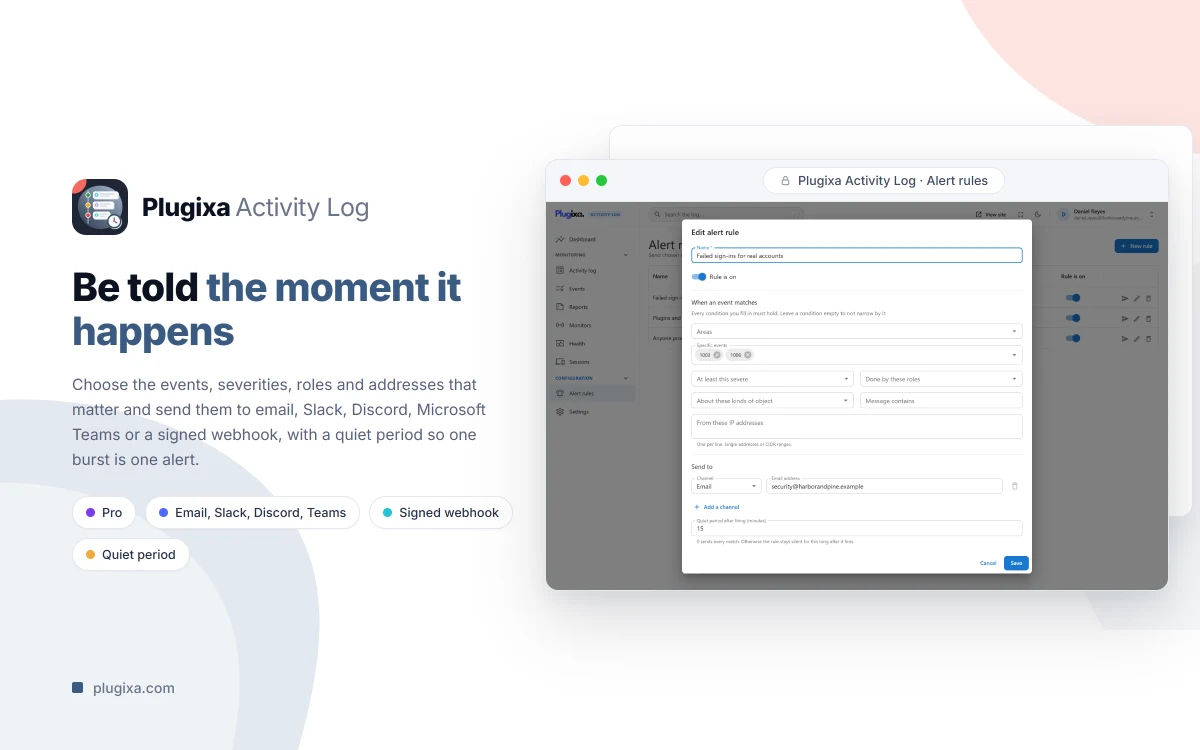
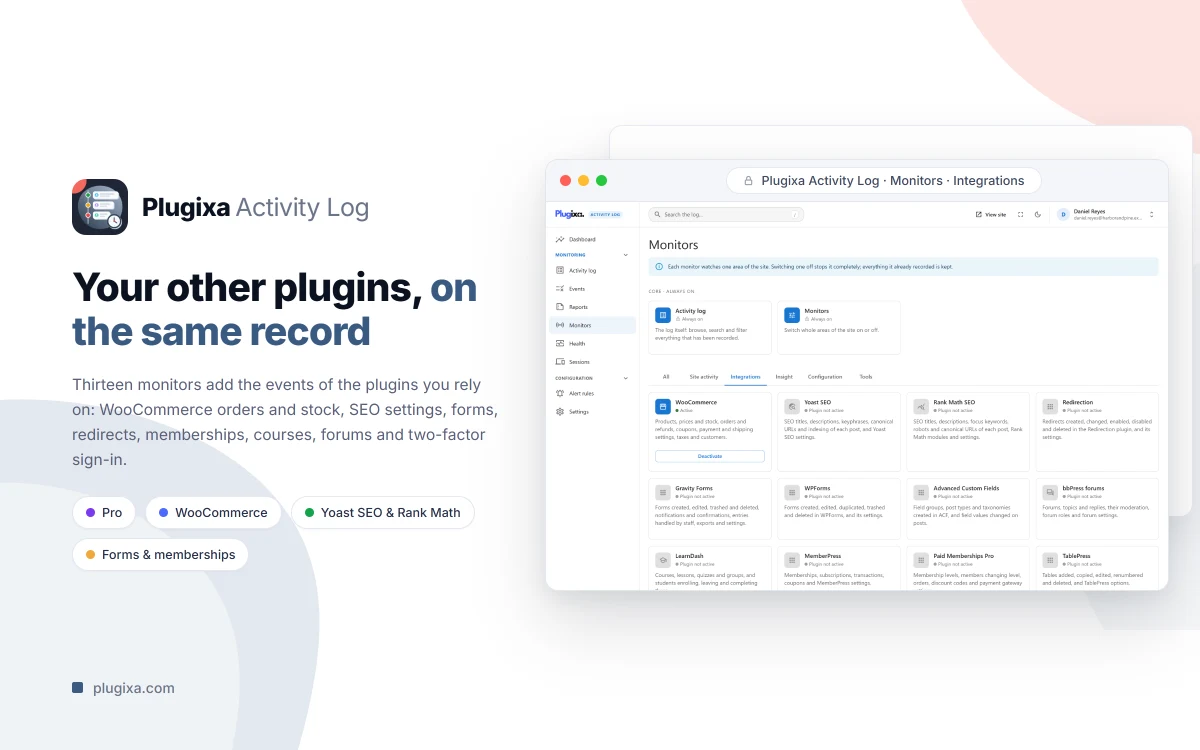
Pro is a separate download that adds what a team or an agency needs: alert rules to email, Slack, Discord, Microsoft Teams or a signed webhook, reports on demand and on a schedule, CSV export, session management with a concurrent-session limit and idle sign-out, IP location from a local MaxMind database, a file integrity scan, a log archive, mirrors to syslog, an HTTPS endpoint or a file, and thirteen monitors for other plugins, WooCommerce among them. Pro costs €39 a year for one site or €59 a year for unlimited sites.
Plugixa Activity Log needs WordPress 6.5 and PHP 8.2 or later. Start with Getting Started, compare the editions in Free vs Pro, or see the Plugixa Activity Log page.