

Contents
Getting started - Plugixa Activity Log
This walks from a clean install to a log with real entries in it. Five minutes, and nothing has to be configured first: recording starts the moment the plugin is activated.
Install
Plugins -> Add New -> Upload Plugin, choose the ZIP, activate. Or unzip into
/wp-content/plugins/ so the main file sits at
/wp-content/plugins/plugixa-activity-log/plugixa-activity-log.php.
Free and Pro are separate downloads, not a switch. The Pro build is the free plugin plus additional code, so there is nothing to unlock in place. Both read and write the same log, so moving from one to the other loses nothing. If both copies end up active, only one runs and a notice tells you which to deactivate.
Activation creates the plugin’s own database tables. It does not create posts or custom post types: an event is a row with typed, indexed columns, which is what keeps a large log fast.
The opt-in screen
After activating you may be shown an opt-in screen from Freemius, the service that handles licensing and updates. Skip is fine. Nothing in the plugin depends on the answer: which features you have is decided by which download is installed, never by this screen. If you skip, no identifiable data is sent.
Where the menu is
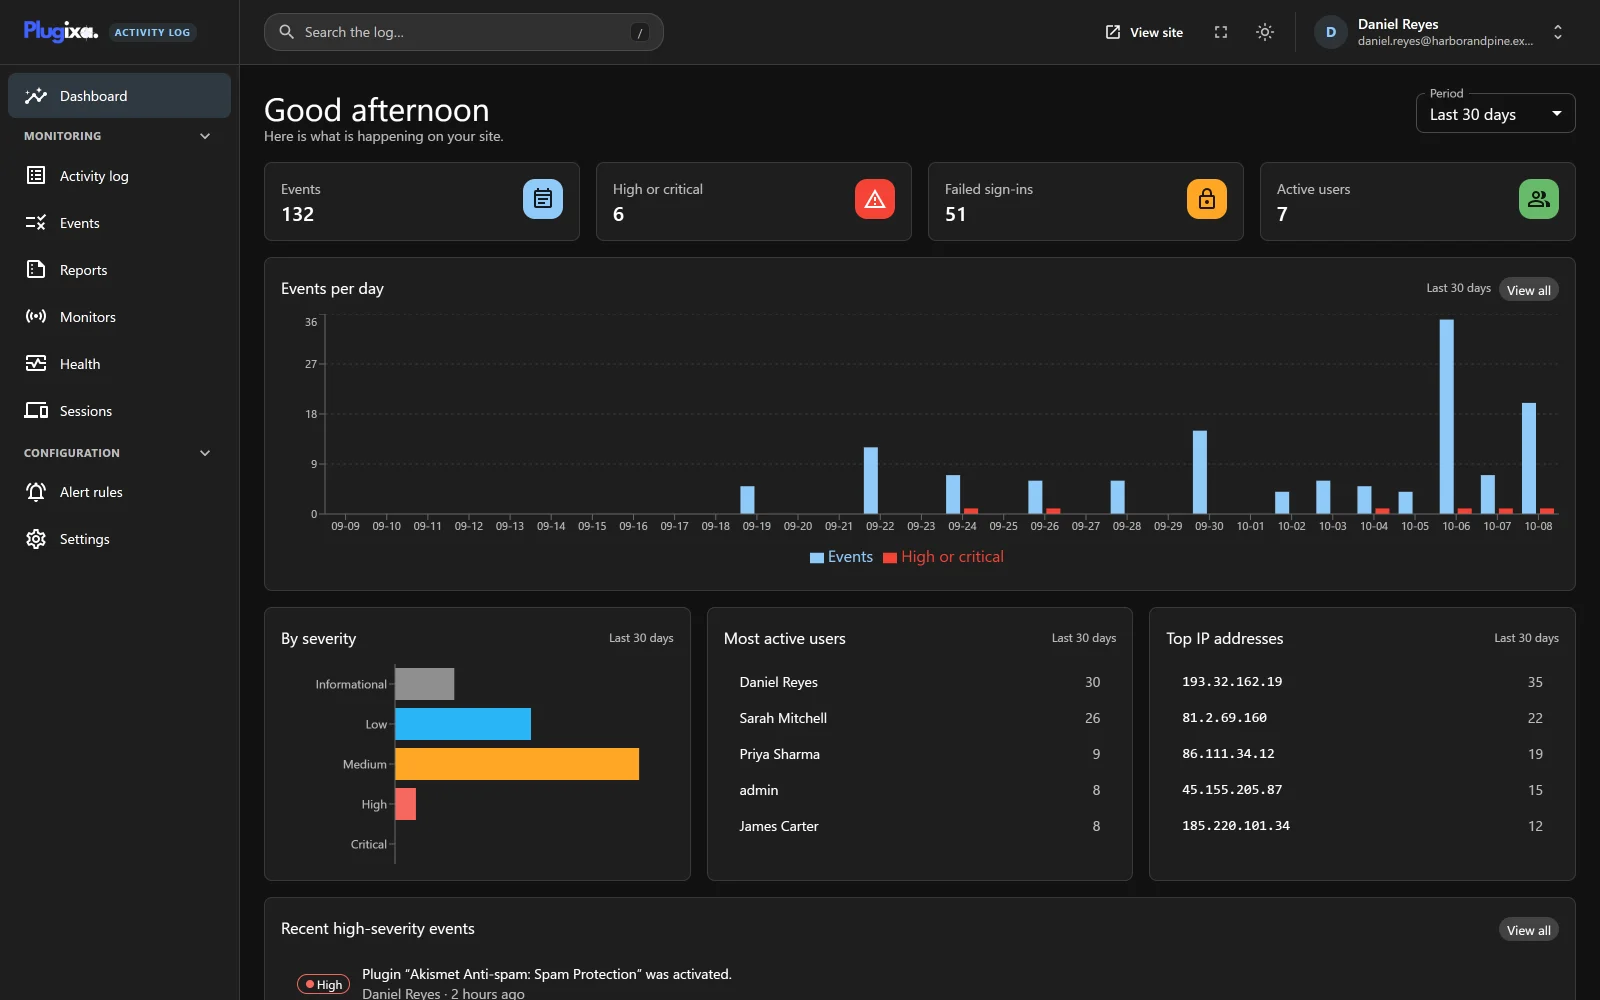
Plugixa Activity Log is a top-level item in the WordPress admin menu. It opens one application with its own sidebar, and the screen it opens on is the Activity log. The sidebar lists Dashboard first, then two sections, Monitoring and Configuration:
| Screen | What it is for |
|---|---|
| Dashboard | Totals, trends and recent serious events |
| Activity log | Everything recorded, newest first |
| Events | Every kind of event, with a switch each |
| Monitors | Whole areas of the site, on or off |
| Health | The state of the log itself |
| Settings | Access, retention, exclusions, privacy, notifications |
Monitors, Health and Settings are shown to people who may change settings: administrators, and on a network, network administrators. Pro PRO adds Reports, Sessions and Alert rules to the same sidebar.
The bar at the top
The bar above every screen holds the same controls wherever you are:
| Control | What it does |
|---|---|
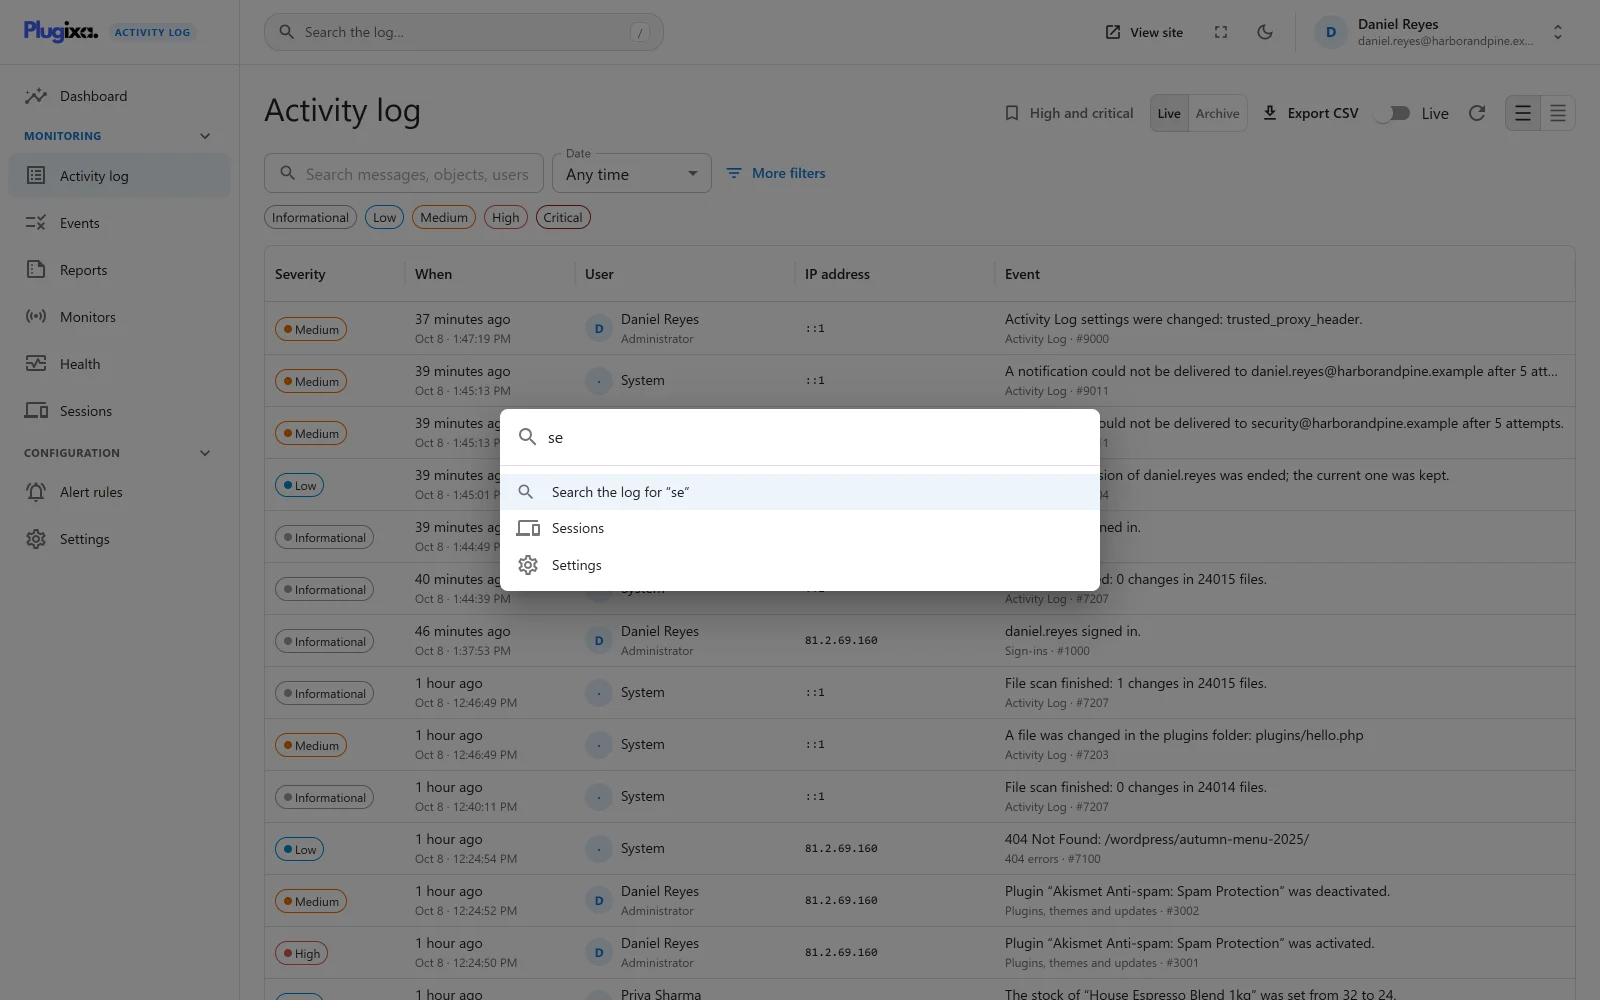
| Search | Opens the command palette. Ctrl+K, or Cmd+K on a Mac, opens it from the keyboard. Type the name of a screen to jump to it, or any text to search the log for it |
| Environment label | Shown when WordPress reports the site as local, development or staging, as a reminder that this is not the live site. It is absent on a production site |
| View site | Opens the front of the site in a new tab |
| Full screen | Puts the page in the browser’s full-screen mode. Shown only where the browser supports it |
| Dark mode / Light mode | Switches the colours. The app starts in the mode your device prefers, and the choice is remembered in this browser only |
| Account menu | Your profile, Exit to WordPress, and Log out |
What is recorded from the first minute
Eight monitors are on from the start:
| Monitor | Watches |
|---|---|
| Sign-ins | Successful and failed sign-ins, sign-outs, password resets |
| User accounts | New and deleted accounts, role, email and password changes, application passwords |
| Posts and pages | Created, published, edited, trashed and deleted, for every post type |
| Media library | Files uploaded, edited and deleted |
| Comments | New comments and every moderation action |
| Menus, widgets and terms | Menus, widgets, categories, tags, Customizer changes |
| Plugins, themes and updates | Installed, activated, updated, edited, deleted, and core updates |
| Site settings | Core WordPress settings, and on a network its sites and members |
Each event carries who did it, their role at that moment, the IP address, and what changed. Passwords, tokens and keys are masked before anything is stored.
Two monitors start switched off: PHP errors and 404 errors. Both can be noisy, so somebody should decide to want them. See PHP Errors and 404s.
First things to do
1 - Look at the log
Open Activity log. If it is still empty, sign out and back in: the sign-in is the first row. Click a row to open it and see everything that was captured. Then switch Live on, do something in another tab - publish a draft, say - and watch it arrive.
2 - Check Monitors
Open Monitors and read the cards. Switch off the areas you do not care about: a monitor that is off attaches no WordPress hooks at all, so it costs nothing. What it already recorded is kept.
3 - Set retention
Settings -> Retention. Events are kept for 90 days by default, and older ones are removed in small batches once a day. Set the number of days your policy needs, a maximum number of events, or both. Zero in both keeps everything for ever, which the Health screen will warn you about.
4 - Add a notification address
Settings -> Notifications. Emails are off until you switch on Email me about serious events. Add the addresses that should receive them, or leave the list empty to use the site’s administration email. The default threshold is high and critical events.
Who can see the log
Administrators, always. Other roles only if you name them under Settings -> Access. Nobody can edit or delete an event, whatever their role: there is no screen and no API route that does it.
Requirements
- WordPress 6.5 or higher
- PHP 8.2 or higher
What to do next
- Learn the main screen: The Activity Log.
- See what each event means: Events.
- Leave your own noise out: Exclusions.
- Coming from another plugin: Import from WP Activity Log.