

Contents
PHP errors and 404s - Plugixa Activity Log
Two monitors record things nobody did on purpose: errors PHP raises while the site runs, and requests for pages that do not exist. They answer “what is quietly going wrong” - and both start switched off.
Why they are off by default
Every other monitor records a person doing something, which happens at a human pace. These two record what the machine and the open internet do, which does not.
- PHP errors installs an error handler on every request, and a site with one noisy plugin can raise the same warning thousands of times a day.
- 404 errors would record every probe for
wp-login.phpbackups and.envfiles, and every public site gets those all day.
Both are useful when you are looking for something - a broken link, a plugin that fails after an update, an address scanning the site - and noise otherwise. So somebody should decide to want them.
Switch them on in Monitors. Once either is on, a section called Error & 404 monitoring appears in Settings with its options. The section is not there while both are off.
PHP errors
What is recorded
| Code | Severity | Event |
|---|---|---|
| 7000 | High | A fatal error |
| 7001 | Medium | A warning |
| 7002 | Low | A notice |
| 7003 | Informational | A deprecation |
| 7004 | Medium | Errors are being suppressed, more than 100 in an hour |
Each entry names the component - which plugin, must-use plugin or theme the file belongs to, or WordPress itself - the message, the file and the line. Open the event for the address that was being requested when it happened.
File paths are stored relative to the WordPress folder, and the same folder is stripped from the message, so the log does not publish the server’s directory layout to everybody who may read it.
How much is recorded
Record, in the settings section, sets the lowest level kept:
| Choice | Keeps |
|---|---|
| Fatal errors only | 7000 |
| Warnings and fatal errors (default) | 7000, 7001 |
| Notices, warnings and fatal errors | 7000 to 7002 |
| Everything, including deprecations | 7000 to 7003 |
Fatal errors are kept at every level. Deprecations are left out by default because a site running an older plugin on a newer PHP can raise hundreds on every page, and they are real but rarely urgent.
What keeps it from flooding
- Each distinct error is recorded at most once an hour. The same message at the same file and line counts as one.
- At most 100 entries an hour in all. The entry that crosses the limit records event 7004 instead, and the rest of that hour is dropped. Seeing 7004 means the site has a real problem, and that the log is not the full list of it.
- At most 50 distinct non-fatal errors are looked at per request.
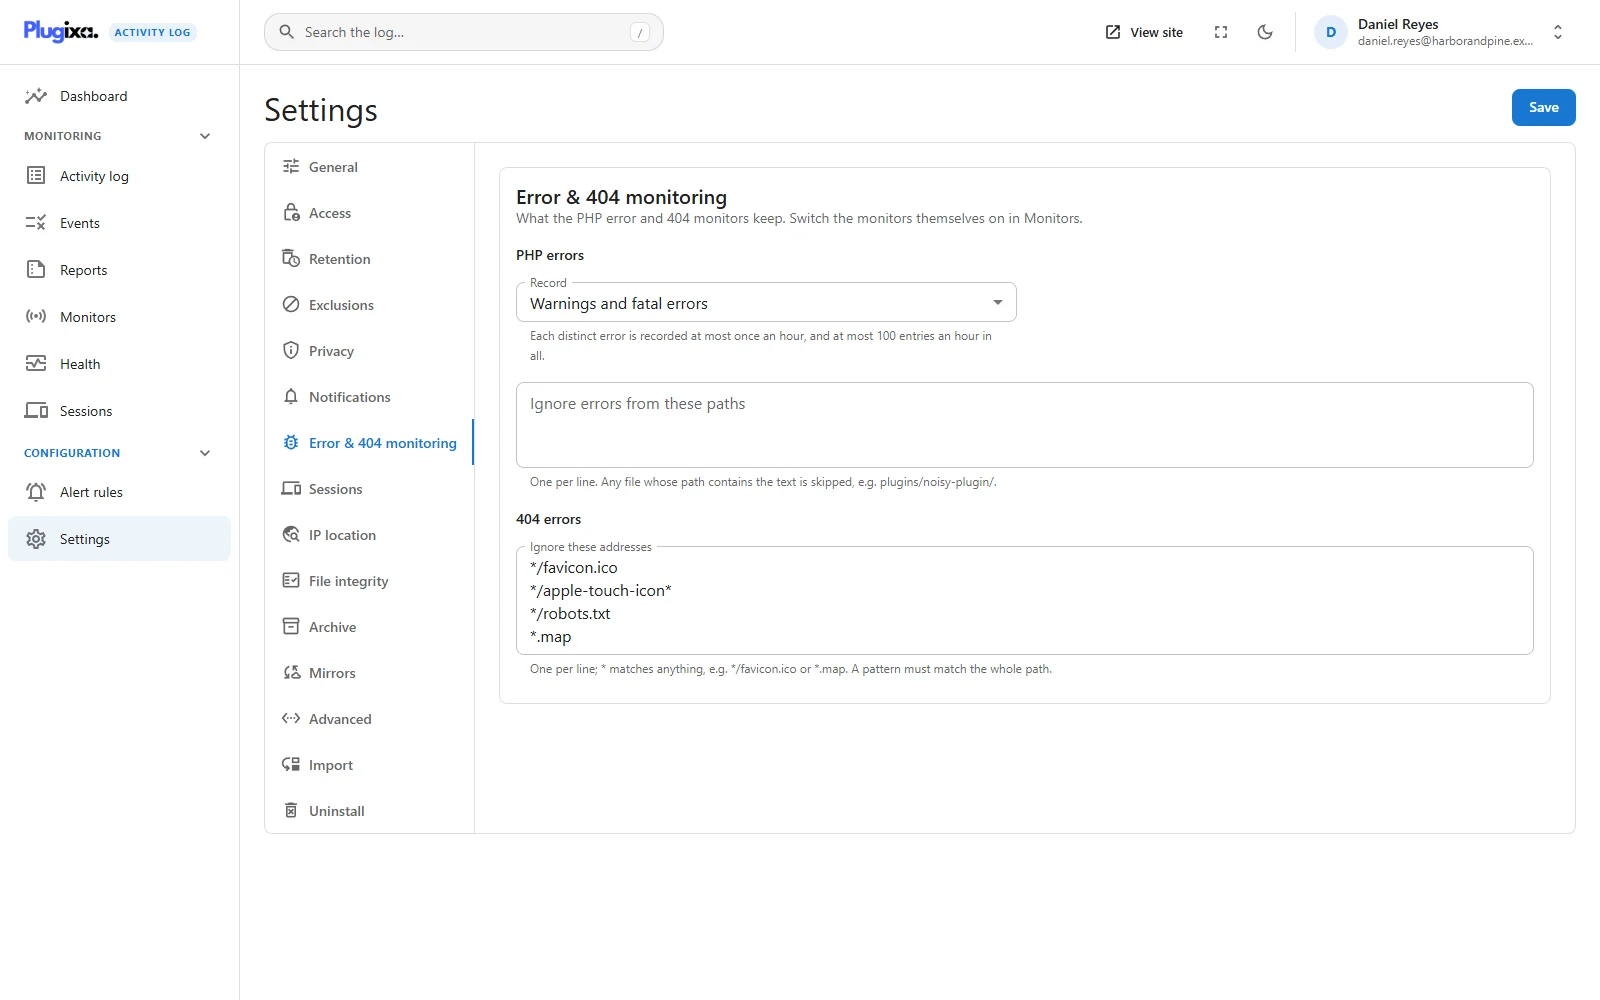
Ignore errors from these paths takes one piece of text per line, up to 50.
Any file whose path contains the text is skipped: plugins/noisy-plugin/ hides
everything from that plugin.
What it leaves alone
The monitor is a guest in PHP’s error handling. Whatever handler was there
before still runs, and the error display, debug.log and WordPress’s own
fatal-error screen behave exactly as they did without it.
Two things are deliberately not recorded: errors silenced in code with @, and
non-fatal errors raised by Plugixa Activity Log’s own files, because a log that
reports on itself can feed itself. Errors the site merely does not display
are still recorded - a production site that hides warnings is exactly the one
that wants them kept somewhere.
404 errors
What is recorded
| Code | Severity | Event |
|---|---|---|
| 7100 | Low | 404 Not Found, with the path |
| 7101 | Medium | Many 404 errors from one address, a possible scan |
Only front-end page requests count. Admin screens, feeds, scheduled jobs, AJAX and REST API requests are not recorded.
Only the path is stored, never the query string. A query string can carry a password-reset key or a tracking token, and a log is the wrong place for either. For the same reason the referring page is cut down to its host and path. Open the event to see it, along with whether the visitor looked like a browser or a bot.
What keeps it from flooding
One address gets 20 recorded 404s per ten minutes. The request that crosses that line records one 7101 possible scan event, at most once an hour per address, and further 404s from that address in the same ten minutes are counted but not stored.
So a scanner asking for five hundred paths costs twenty rows and one warning, not five hundred rows. The 7101 event is the one worth a notification or an alert rule PRO.
The ignore list
Ignore these addresses takes one pattern per line, up to 50. * matches
anything, the match ignores upper and lower case, and a pattern must match the
whole path. It starts with:
*/favicon.ico
*/apple-touch-icon*
*/robots.txt
*.map
The leading * is what lets a pattern match on a site installed in a
sub-directory. wp-login on its own matches nothing; *wp-login* matches any
path containing it.
Reading them in the log
Both monitors have their own group, so More filters -> Group narrows the activity log to PHP errors or 404 errors. For 404s, type the start of an address in the search box to follow one visitor.
Troubleshooting
| Symptom | Usual cause |
|---|---|
| There is no Error & 404 monitoring section in Settings | Both monitors are off. Switch one on in Monitors. |
| An error I can see on screen is not in the log | It was already recorded within the last hour, or it is below the level set under Record. |
| No deprecations are recorded | The default level is warnings and worse. Choose Everything. |
| 7004 appears every hour | More than 100 new errors an hour. Fix the loudest, or add its path to the ignore list. |
| A plugin’s errors never appear | Its path is on the ignore list, or the errors are silenced with @. |
| Only fatal errors are recorded, whatever the level | PHP itself is configured to report fatal errors only, and the monitor respects that. |
| A missing page is not recorded | It matches the ignore list, or that address passed 20 in ten minutes. |
| An ignore pattern does nothing | It must match the whole path. Add * at both ends. |
| 404s show no query string | Deliberate. Only the path is kept. |
| The log filled up after switching 404s on | The site is being scanned from many addresses. Ignore the common patterns, or switch the monitor off again. |