

Contents
The activity log - Plugixa Activity Log
The activity log is the main screen. It answers one question, as narrowly as you care to ask it: who did what, when, and from where.
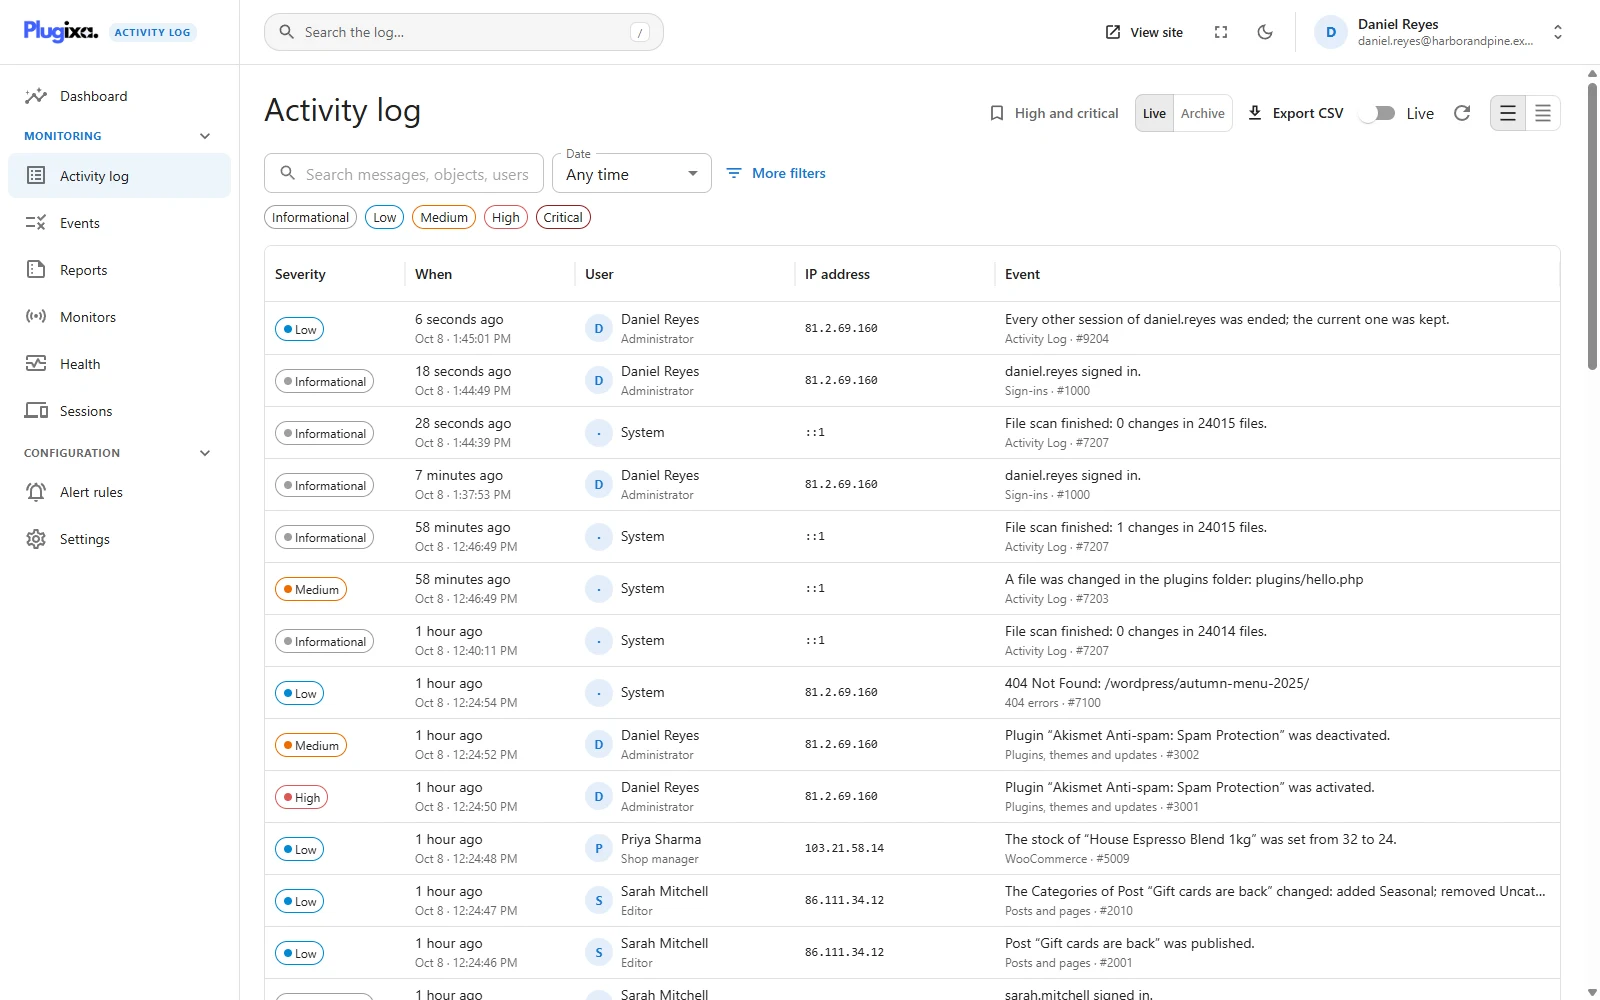
The columns
Events are listed newest first. The order is fixed: a log is read from the top.
| Column | What it shows |
|---|---|
| Severity | Informational, low, medium, high or critical, as a coloured chip |
| When | How long ago, with the date and time beneath. Hover for the exact moment |
| User | Who did it, with the role they had at that moment beneath. “System” when nobody was signed in |
| IP address | Where the request came from. A dash for scheduled jobs and WP-CLI |
| Event | The sentence describing what happened, with its group and event code beneath |
Times are shown in the site’s timezone and in your WordPress language, not the browser’s.
The sentence never changes; the name does. The message is stored when the event happens, so old entries keep their wording when a later release improves a sentence. The person’s name is looked up when you read the log, so renaming Sarah Mitchell renames her across the whole history. If her account is deleted, the username recorded at the time is shown instead.
The two buttons at the far right of the header switch between comfortable and compact rows. Compact drops the second line of each cell. Your choice is remembered in this browser.
Severity chips
The row of five chips under the search box filters by severity. Click one to switch it on, click again to switch it off, and combine as many as you like: High and Critical together is the “what should worry me” view.
Date
The Date menu offers Any time, Today, Yesterday, Last 7 days, Last 30 days and Custom range, which adds a From and a To field. Days are days in the site’s timezone, so “Today” means today where the site is.
Search
The search box looks through the message, the object’s name and the username.
- Words match from their start.
publifinds “published”. Several words must all be present. - Something shaped like an address matches the IP address by prefix.
203.0.113.finds every event from that range. This is the quickest way to follow one visitor. - Very short terms still work. The full-text index ignores words under three characters, so a search containing one is matched as typed, anywhere in the text, instead of silently finding nothing.
More filters
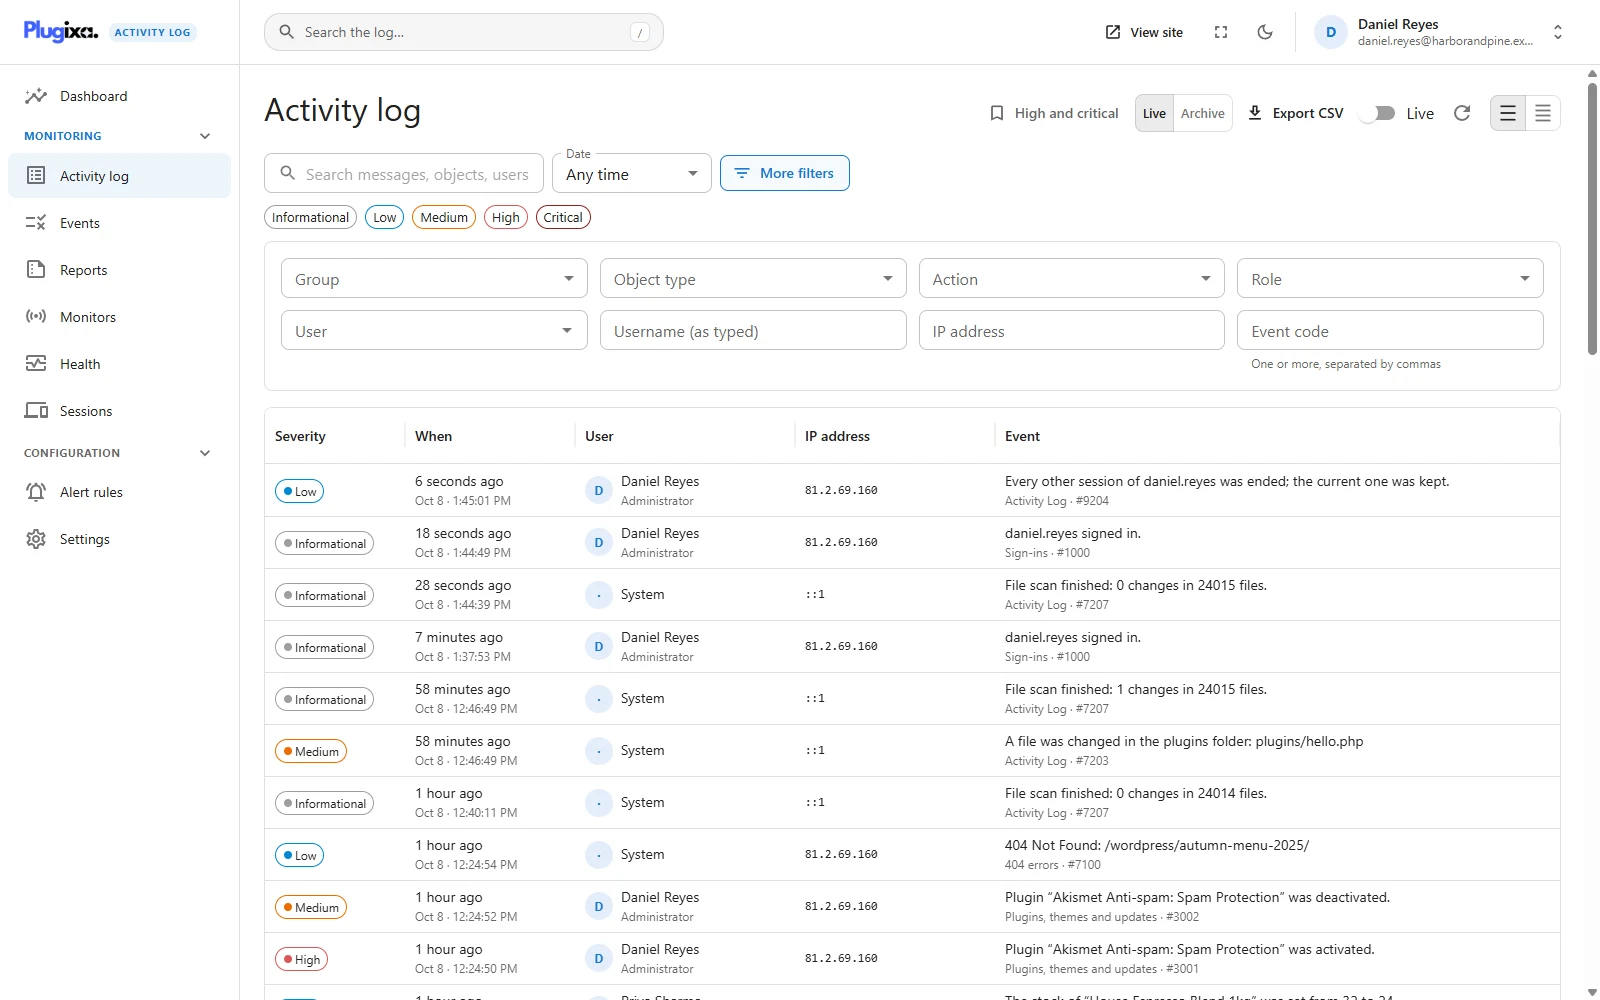
More filters opens a panel of narrower conditions. The badge on the button counts how many are set.
| Filter | Narrows to |
|---|---|
| Group | One area: sign-ins, user accounts, posts and pages, and so on |
| Object type | The kind of thing: post, user, plugin, option |
| Action | The verb: created, modified, deleted, failed |
| Role | The role the person had at the time |
| User | One account, picked by name |
| Username (as typed) | The login recorded with the event |
| IP address | One exact address |
| Event code | One or more codes, separated by commas |
Username (as typed) is how you find failed sign-ins. A failed attempt for a username that does not exist has no account behind it, so the User picker cannot find it. The name that was typed can.
Every condition in force appears as a chip you can remove, even with the panel closed, so nothing narrows the list invisibly. Clear filters removes them all.
The address bar is the filter. Every condition lives in the URL, so a filtered log is a link you can paste to a colleague. To keep one, see Saved Views.
Opening an event
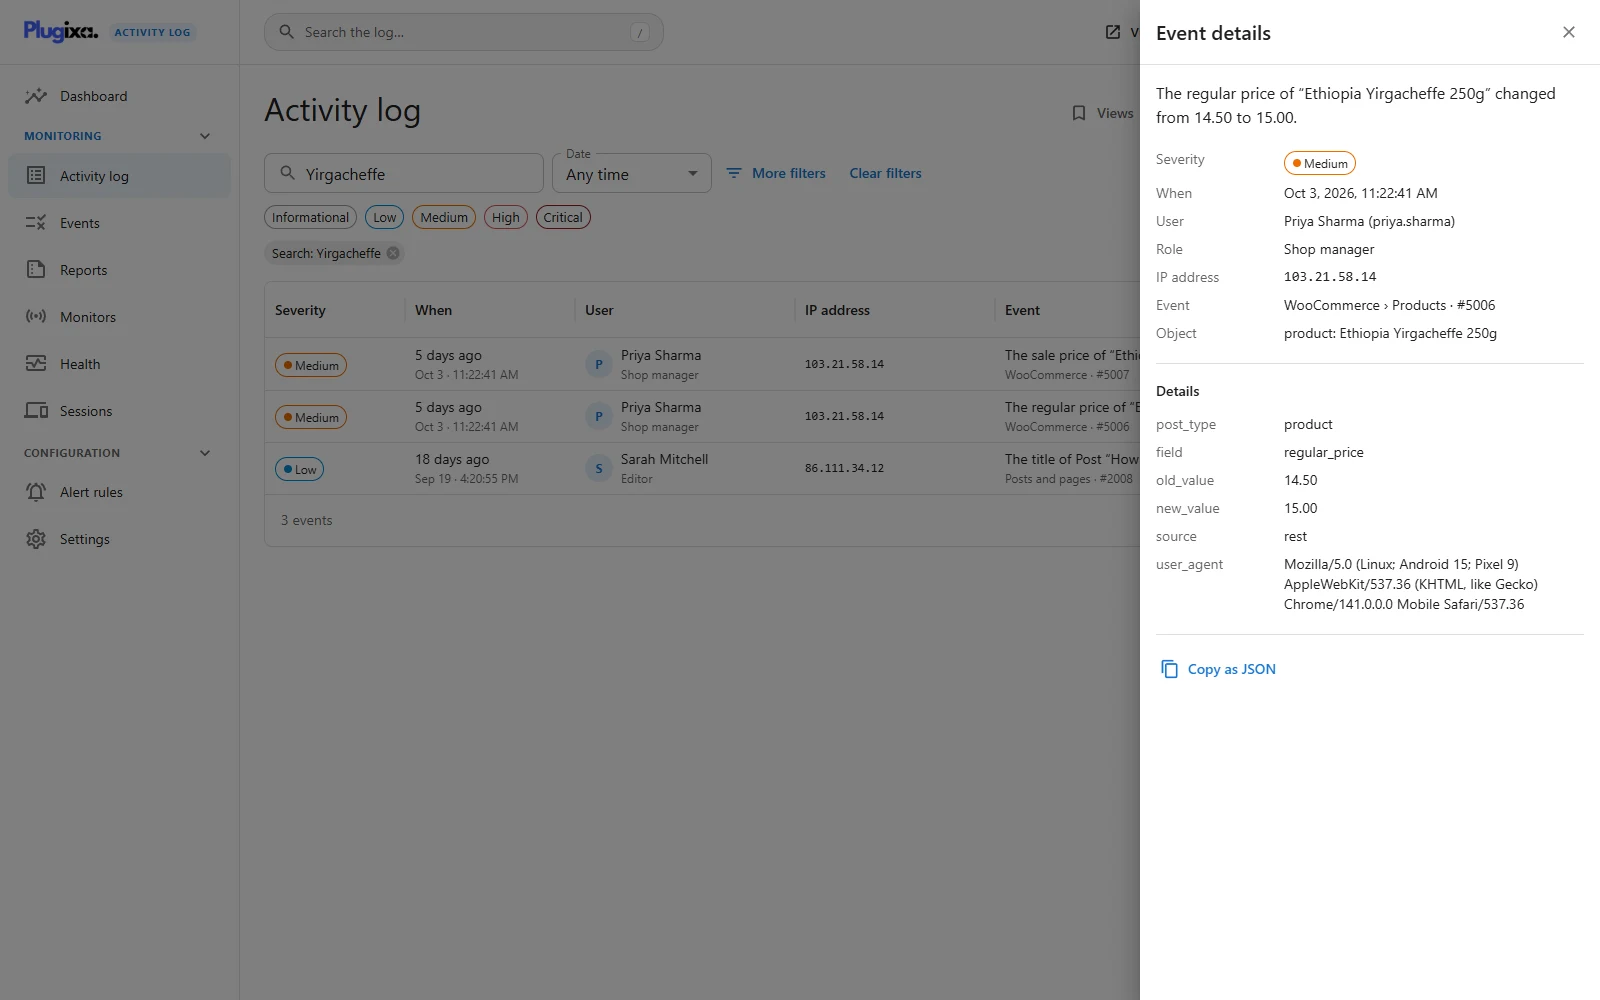
Click a row and a panel opens with everything that was recorded:
- the full sentence, severity and exact time;
- the user, their username, and account deleted if it no longer exists;
- the role, the IP address, the group and the event code;
- the object, with an Open link when it still exists and you may edit it;
- Details: every value captured, such as old and new values, how the request arrived (web, ajax, rest, cron or cli) and the browser.
Passwords, tokens and keys appear as [redacted]: they were masked before the
event was stored. Copy as JSON copies the whole event. The open event is in
the address bar too, so a link can point at one entry.
Live
Switch Live on and the log asks for new events every five seconds. New rows arrive at the top, highlighted for a moment, without disturbing what you are reading. Live respects your filters: with High selected you watch only high events arrive.
Polling stops while the tab is in the background. If more arrived than one check can carry, the list reloads from the top rather than show a run with a hole in it.
Load more, and the total
The log loads one page at a time - 50 events by default, set under Settings -> General, from 10 to 200. More load as you reach the bottom, and the Load more button does the same on demand. When everything is on screen the footer says All events shown.
The total at the bottom left is as exact as it is cheap to be:
| You see | Meaning |
|---|---|
1,234 events |
Counted exactly |
10,000+ events |
A filtered view with more than ten thousand matches |
~1,200,000 events |
The whole log, estimated by the database |
Live and Archive PRO
With the archive switched on, a Live / Archive toggle appears in the header. It changes which store the log reads. Filters, paging and the inspector work the same on both.
Why events cannot be edited or deleted
There is no edit button, no delete button and no bulk action, and that is the design. No REST route does either, so it is not a matter of permissions: an administrator cannot do it, and neither can somebody who has stolen an administrator’s session.
Events leave the log in exactly three ways: retention removes the oldest, the archive PRO moves them, and a privacy erasure request anonymises one person’s rows. Each of those is itself recorded.
Troubleshooting
| Symptom | Usual cause |
|---|---|
| The log is empty | Nothing has happened since activation, or a filter is set. Check for chips under the search box. |
| The log opens already filtered | You have a default saved view. |
| An expected event is missing | Its monitor or the event itself is switched off, or the user, role, address or post type is excluded. |
| A search finds nothing | Every word must match. Try fewer words. |
| The IP address filter does nothing | It needs one complete, valid address. For a range, type the start of it in the search box. |
| The IP address column is a dash | The event came from a scheduled job or WP-CLI, or IP storage is switched off in Privacy. |
| A site administrator sees fewer events than a super admin | On a network, a site administrator sees their own site only. |
What to do next
- Keep a filter: Saved Views.
- Decide what is recorded: Events and Monitors.
- Take the filtered log away: Export PRO.