

Contents
Health - Plugixa Activity Log
Every other screen is about the site. The Health screen is about the log itself, and it answers one question: is the log in good shape, or is something quietly not happening?
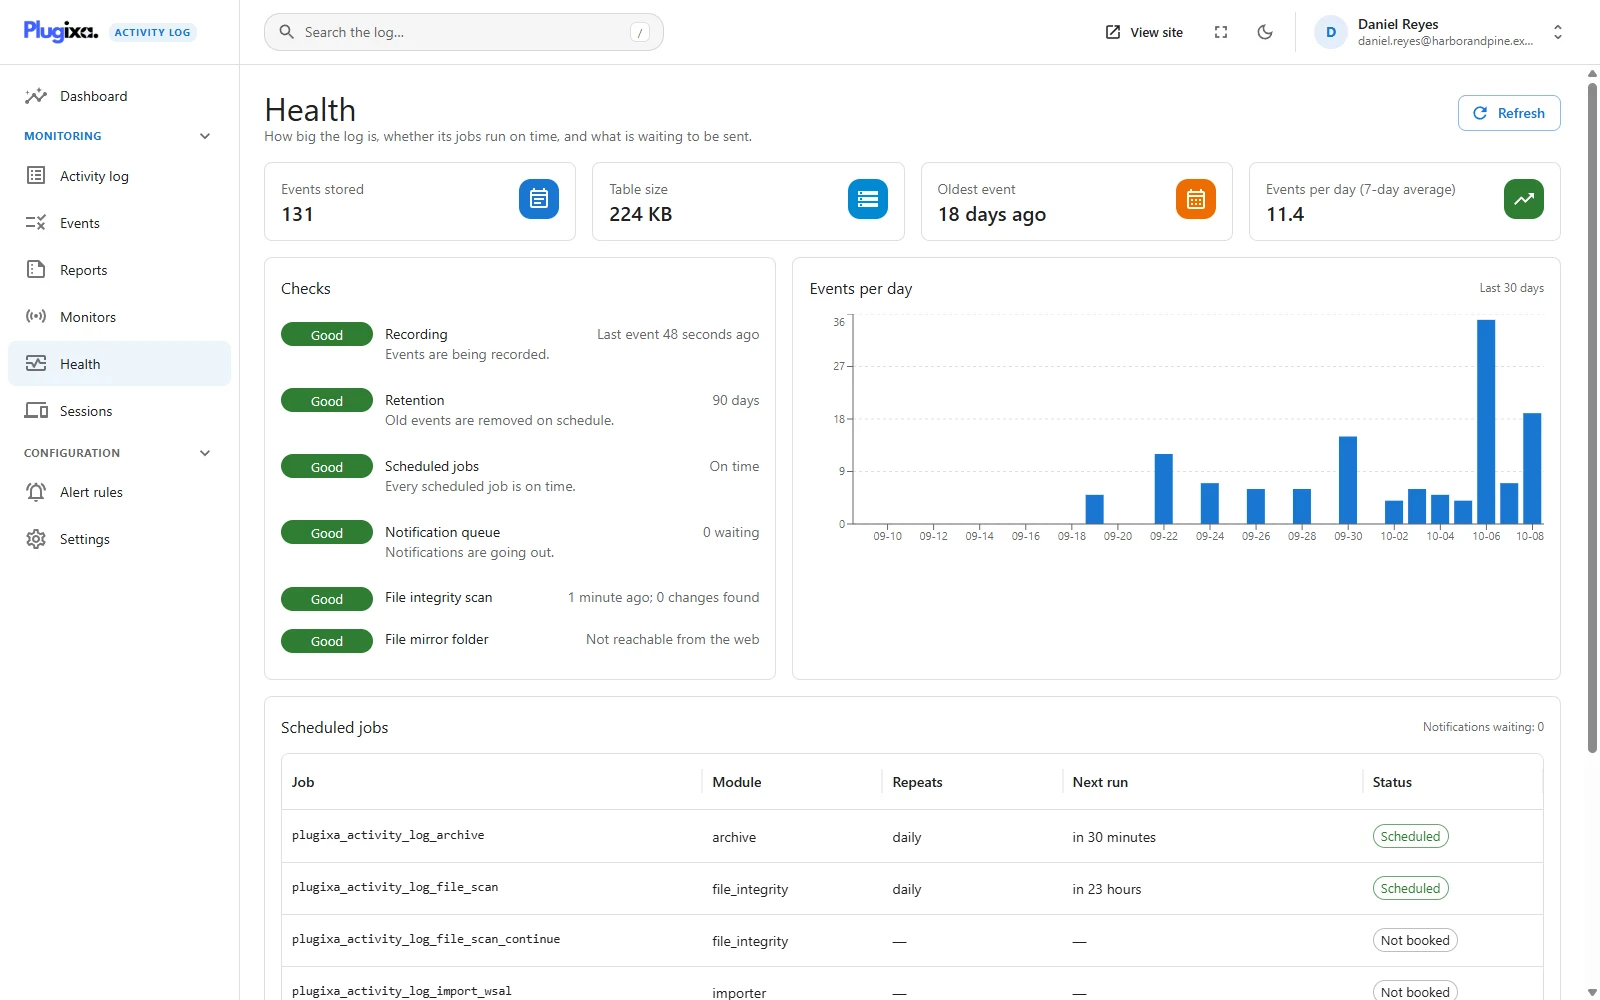
It is under Monitoring -> Health, and is shown to people who may change settings. Refresh at the top right measures everything again.
The four figures
| Figure | How it is measured |
|---|---|
| Events stored | Counted exactly up to 10,000. Above that, the database’s own estimate, shown as ≈ N |
| Table size | Data plus indexes, as the database reports it. A dash when the database does not say |
| Oldest event | How long ago the earliest event in the log happened |
| Events per day (7-day average) | The last seven days, in the site’s timezone, averaged |
The ≈ is honest, not vague. Counting millions of rows exactly is the
slowest thing a log can do. Past ten thousand the database’s estimate is used
instead, and it can be off by tens of percent. Treat it as “about 1.2 million”,
not as a figure to reconcile.
Oldest event is the quickest check on retention. With events kept for 90 days, it should read about three months. If it reads a year, the daily clean-up is not running.
Checks
Each check gives a verdict - Good, Check or Needs attention - a short figure, and one sentence on what it means or what to do.
| Check | Check when | Needs attention when |
|---|---|---|
| Recording | Nothing has been recorded for 7 days | Never |
| Retention | Nothing is ever deleted, or the log holds events older than the retention period plus two days | Never |
| Scheduled jobs | A job is overdue | A job is stalled |
| Notification queue | The oldest delivery has waited more than an hour | More than a day |
Two Pro features PRO add a check of their own to this list, and no others do: the file integrity scan, and File mirror folder, which says whether a visitor could download the mirrored log. See File Integrity and Mirrors.
Recording on a site nobody touched for a week is not a fault, but it is worth one look at Monitors to be sure the ones you rely on are on.
Retention warns about a log that is kept for ever: zero days and zero maximum events, or the Retention feature switched off. The two days of grace on the other condition are there because the clean-up runs daily and works through a large backlog over several runs. See Retention.
Events per day
One bar per day for the last 30 days, in the site’s timezone, with quiet days drawn as zero. It is the growth rate of the table: multiply the average by your retention period and you have roughly how many events the log will settle at.
Scheduled jobs
Old events are removed, notifications are sent and history is imported by scheduled jobs. If those do not run, nothing visibly breaks. The log just keeps growing and the emails stop. This table is where you see it.
It lists every job of the plugin with what repeats, when it runs next, and a status:
| Status | Meaning |
|---|---|
| Scheduled | Booked, and not more than an hour late |
| Overdue | More than an hour late |
| Stalled | More than a day late. Nothing is running WP-Cron |
| Not booked | A feature has this job but has not booked it |
Not booked is usually normal. Several jobs are booked only when there is work: an empty notification queue, a report nobody scheduled, a database download with no licence key entered.
Overdue on a quiet site is expected. WP-Cron runs only when somebody visits
the site, so with no visitors, jobs wait. The fix for a site that is quiet by
nature is a server cron job that calls wp-cron.php.
If DISABLE_WP_CRON is set, a notice at the top says so. That is fine as long
as a server cron job is doing the work, and the Scheduled jobs check tells you
which it is: Server cron when jobs are on time, Running late or
Stalled when nothing is running them.
The card’s caption shows Notifications waiting: deliveries in the queue right now. A number that goes up and never comes down is the same problem seen from the other side.
In WordPress Site Health
The same feature adds two tests and an Info section to WordPress’s own Tools -> Site Health, for the people who look there rather than here.
- The activity log’s scheduled jobs are running - recommended when a job is overdue, critical when one is stalled.
- The activity log is kept to a sensible size - recommended when the clean-up is behind, or when the log keeps everything for ever and has passed a million events.
- Info -> Plugixa Activity Log - version, events stored, table size, oldest event, retention, WP-Cron, next clean-up and notifications waiting. This is what to paste into a support request.
Only two tests, on purpose. Site Health is read by people who did not install this plugin, so it carries the problems that need acting on, not every figure.
For developers
Other code can add a check to the Health screen with the
plugixa_activity_log_health_checks filter:
add_filter(
	'plugixa_activity_log_health_checks',
	static function ( array $checks, array $report ): array {
		$checks[] = array(
			'id'     => 'my_queue',     // unique slug
			'label'  => 'My queue',
			'status' => 'warning',      // good | warning | critical
			'value'  => '12 waiting',   // a short figure
			'hint'   => 'One sentence: what it means or what to do.',
		);

		return $checks;
	},
	10,
	2
);
Items without an id or a label are dropped, a repeated id keeps the first,
and an unknown status is read as warning.
GET /wp-json/plugixa-activity-log/v1/health, for people who may change
settings, returns the whole report: events, per_day, avg_7, avg_30,
retention, cron, queue and checks. See the
REST API.
Troubleshooting
| Symptom | Usual cause |
|---|---|
| “Health checks are switched off” | Health was deactivated on the Monitors screen. Switch it back on. |
Events stored shows ≈ |
The log holds more than 10,000 events, so the figure is the database’s estimate. |
| Table size is a dash | The database did not report a size for the table. |
| Retention says “Kept for ever” | Both retention limits are zero, or Retention is switched off. |
| Oldest event is far older than the retention period | The daily clean-up is not running. Look at the scheduled jobs. |
| Every job is overdue | Nothing is triggering WP-Cron. Add a server cron job. |
| One job says Not booked | It has no work to do. |
| Notifications waiting keeps growing | The send job is not running, or the site cannot send email. |
What to do next
- Bound the log: Retention.
- Fix what is not sending: Notifications.
- Work through a symptom: Troubleshooting.