

Contents
Troubleshooting - Plugixa Activity Log
Most questions about the log are one of a handful, and most of those are the log doing what it was told. Start with the Health screen.
Where do I look first?
Monitoring -> Health. It says when the last event was recorded, whether retention is keeping up, whether every scheduled job is on time, and how many notifications are waiting.
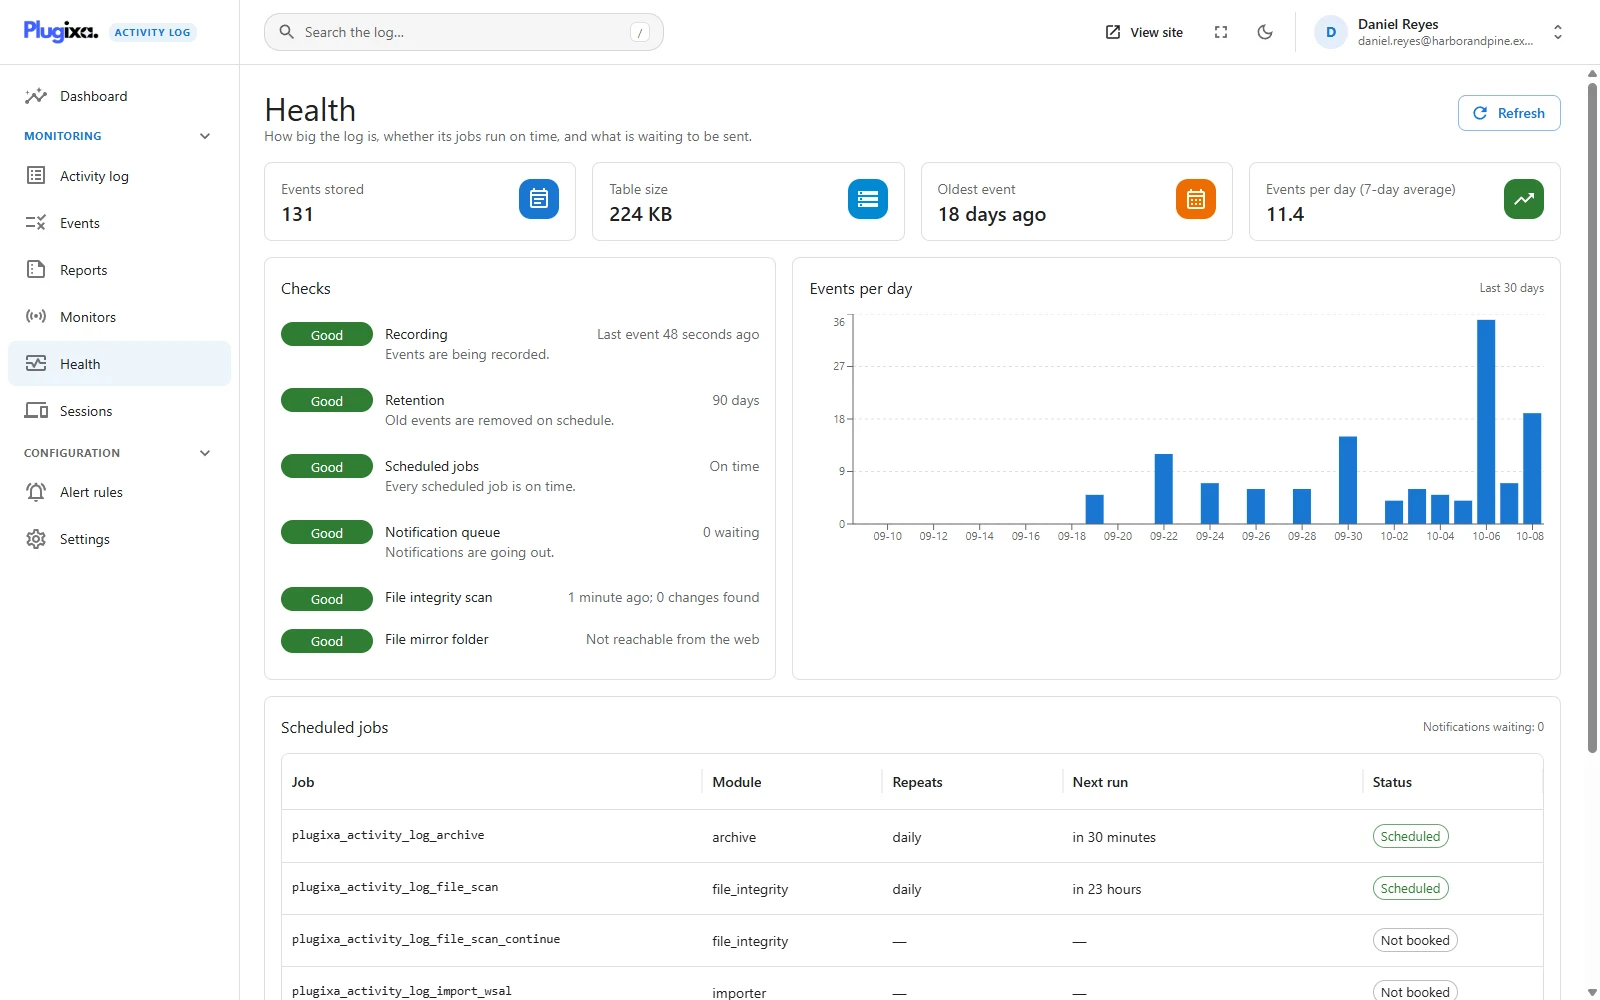
A check that is not green says what it means in one sentence. See Health.
Why is nothing being recorded?
Recording stops for one of four reasons, in this order of likelihood.
| Cause | How to tell |
|---|---|
| The monitor is switched off | Monitors shows its card off |
| The event is switched off | Events shows the event off |
| An exclusion matches | Settings -> Exclusions lists the user, role, address or post type |
| It was switched off from a terminal | The log holds event 9000 or 9002 with source cli |
The PHP error and 404 monitors are off on a new install, until you switch them on.
A monitor for another plugin PRO records nothing while that plugin is not active, whatever its switch says.
From a terminal, wp activity-log monitors and wp activity-log events answer
the question at once. Every switch is also in the log itself: filter by event
codes 9000 (settings changed) and 9002 (monitor switched) to see who did it and
when. No exclusion can hide those two.
If everything stopped at once, suspect an exclusion that matches everybody: an excluded IP range that covers your proxy, or an excluded role that every user holds. See Exclusions.
Why does every event show the same address, or 127.0.0.1?
The site is behind a reverse proxy, a load balancer or a CDN. The log records the address of whatever connected to the web server, and that is the proxy.
Fix: open Settings -> Advanced and set Read the visitor address from
to the header your proxy sets, for example HTTP_CF_CONNECTING_IP behind
Cloudflare.
Choose the right one, and only if you are behind a proxy. Otherwise any visitor can send that header and choose the address that gets logged. The change applies to new events only. See the Advanced section of Settings.
Why did failed sign-ins stop appearing during an attack?
By design. A password-guessing bot can send thousands of attempts a minute, and logging every one would turn the log into a way of filling your database.
- The first 30 failed sign-ins from one address are recorded individually.
- The next one records a single summary, event 1006, high severity: More than 30 failed sign-ins came from (the address). Further attempts from it are not logged individually for 10 minutes.
- After that, attempts from that address are counted but not stored.
- Individual logging resumes once that address has been quiet for ten minutes.
The limit is per address, so failed sign-ins from everywhere else are still recorded, and event 1006 keeps the flood itself visible.
Why are notifications not arriving?
Work down this list. Each is a real cause.
| Cause | Check |
|---|---|
| They are off | Email me about serious events is off until you switch it on |
| The event is below the threshold | Notify me about defaults to high and critical |
| It is one of the plugin’s own events | Events 9000 and above never send a notification |
| WP-Cron is not running | Emails are sent by a background job, never on the recording request. Health shows it late or stalled |
| The hourly limit was reached | Default 20. Past it, one final email says there is more, and the rest are dropped |
| They are bundled | Delivery every 5, 15 or 60 minutes holds them until the window ends |
| The site cannot send mail | Press Send test email. It uses the saved recipients, so save first |
| Delivery keeps failing | After 5 attempts the log records event 9011 |
WP-Cron only runs when somebody visits the site. On a quiet site an alert
waits for the next visitor. If alerts matter, add a server cron job that calls
wp-cron.php every few minutes. See Notifications.
Why does search not find what I typed?
Search is a database full-text search, built to stay fast on millions of rows. It behaves like a search engine, not like “contains”.
| What you typed | What happens |
|---|---|
publi |
Finds published. Each word matches the start of a word |
lished |
Finds nothing. The middle or end of a word does not match |
plugin activated |
Finds entries containing both words, in any order |
wp, or any word under three characters |
A plain “contains” match on the whole phrase |
192.168.1 |
Matches the IP address by its beginning |
Search reads the message, the item name and the user name. It does not read the extra details shown in the inspector. For a value that only appears there, and for anything exact, use the filters: user, role, IP address, event and date.
Leave out very common words such as the, was or for. MySQL does not index them, and every word you type must match. See The activity log.
What does “could not finish setting up its database tables” mean?
A red notice on the Plugins screen, the Dashboard and the plugin’s own screens: Plugixa Activity Log could not finish setting up its database tables.
It names the missing table and quotes what the database answered. The usual causes are the two the notice gives: the database user is not allowed to create tables, or the database is out of space.
Fix the cause with your host, giving them the table name and the quoted answer, then press Try again now. The plugin also retries by itself every few minutes. The notice cannot be dismissed; it disappears with the first set-up that finishes.
Why does it say two copies of the plugin are active?
Two copies of Plugixa Activity Log are active. Only one can run…
The free and premium builds install side by side. Activating the premium one inside wp-admin normally deactivates the free one; activated from WP-CLI or a hosting panel, both stay active.
Nothing is lost. Only one copy runs, and the notice names the one that was not loaded. Both builds share the same tables. Deactivate the copy you no longer need. Deleting it keeps the log even with the erase option on, because the plugin refuses to erase while another copy is installed.
Why are the scheduled jobs late or stalled?
Retention, notifications, the importer, and in Pro the archive, mirrors, reports, file scans and database updates all run through WP-Cron. Health lists each job with its next run and a status.
Overdue (more than an hour late) on a site with little traffic is WP-Cron
waiting for a visitor. Stalled (more than a day late) usually means
DISABLE_WP_CRON is set and no server cron has taken its place. Either way the
fix is the same: a server cron job that calls wp-cron.php every few minutes.
Not booked is normal for a job that is booked only when there is work.
Smaller questions
| Symptom | Cause |
|---|---|
| Somebody cannot see the log, or sees it without Settings | Access is by role, and a granted role is read-only. See Access. |
| An event shows System as the user | Nobody was signed in: a scheduled task or WP-CLI did it. |
| WP-CLI times differ from the screen | The CLI prints UTC. The screens use local time. |
| Old events are not being deleted | The daily clean-up is late (see Health), or both fields under Settings -> Retention are 0. wp activity-log prune applies it now. |
| Deleting the plugin kept the log | That is the default. Settings -> Uninstall decides. |
| A PHP error is logged once although it happens constantly | Each distinct error is recorded at most once an hour, and at most 100 entries an hour in all. |
| An old link to an event stopped working after an import | The event was resequenced and has a new id. |
What to do next
- Read the screen that answers most of this: Health.
- Check what is switched on: Monitors.
- Check what your edition has: Free vs Pro.