

Contents
Dashboard - Plugixa Activity Log
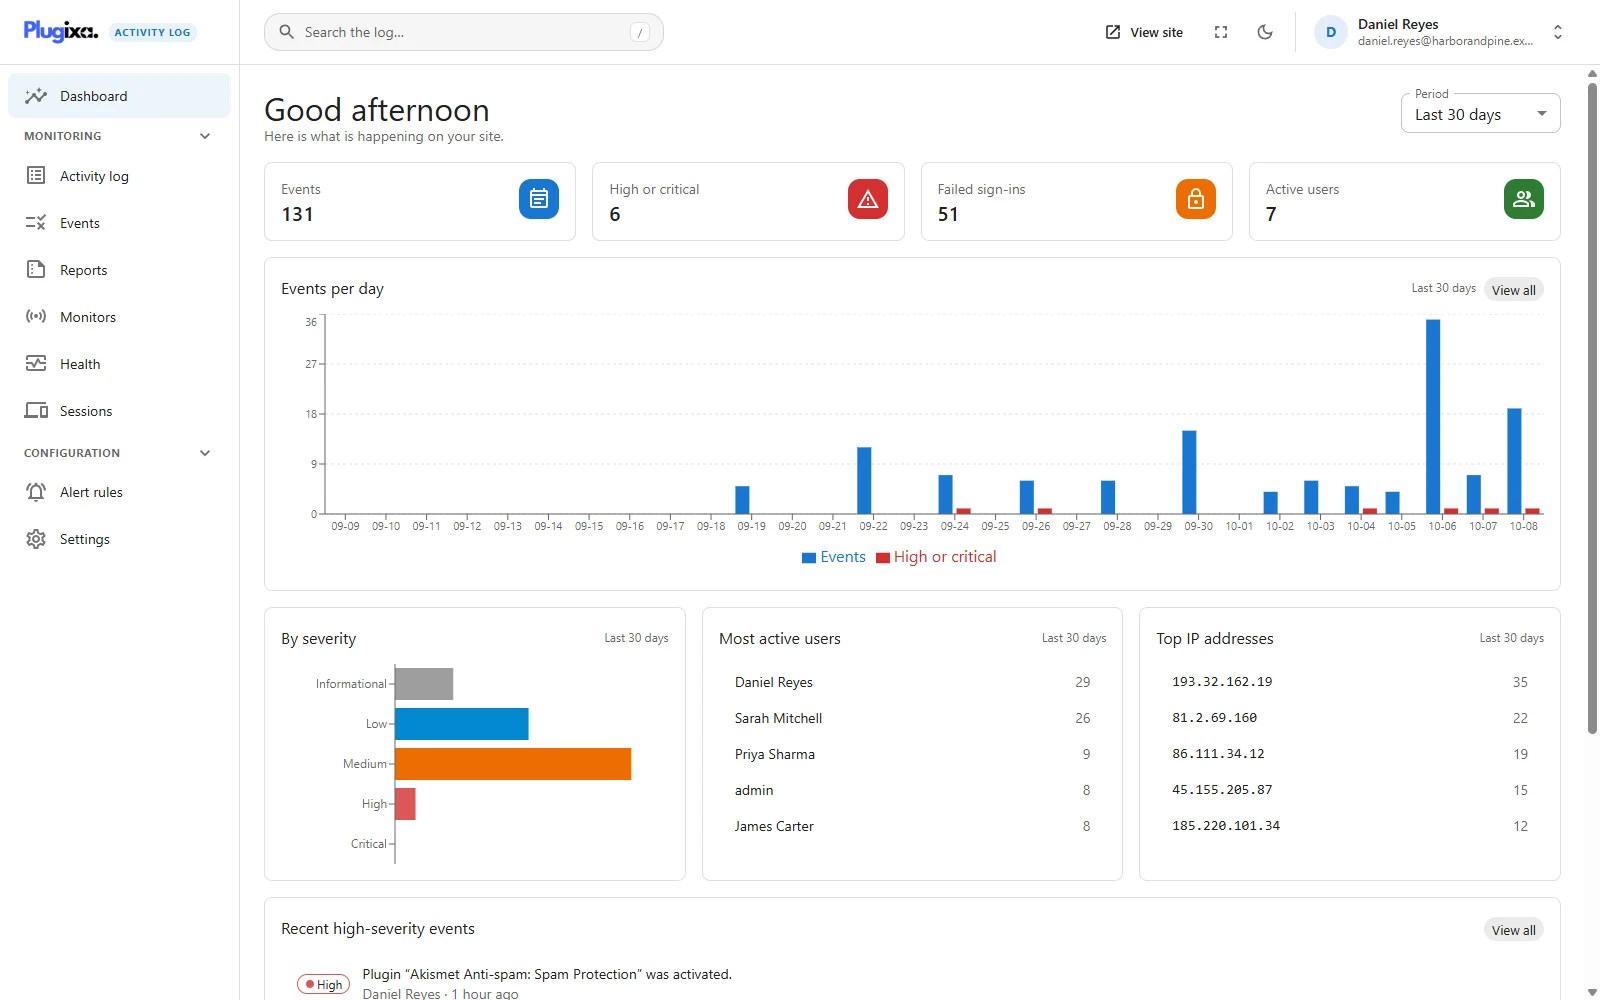
The dashboard is the overview. It answers four questions about a period you choose: how much happened, how much of it was serious, who was doing it, and where it came from.
The period
The Period selector at the top right offers Last 7 days, Last 30 days and Last 90 days. It opens on 30. Every card on the screen follows it.
A period is whole days of the site’s calendar, today included. Last 30 days starts at midnight 29 days ago, in the site’s timezone. That is the same thing the log’s own Last 30 days filter means, so every figure here equals the bars under it and the list its tile opens.
The four figures
| Figure | How it is counted |
|---|---|
| Events | Every event recorded in the period |
| High or critical | Events whose severity is high or critical |
| Failed sign-ins | Failed sign-in attempts, for unknown names and for real accounts |
| Active users | Distinct signed-in users with at least one event |
Active users counts people, not visits. Sarah Mitchell editing forty posts is one active user. Events with no signed-in user - a failed sign-in, a scheduled job, a 404 - have nobody to count and add nothing to this figure.
Failed sign-ins is a floor during an attack. After 30 failed sign-ins from one address in ten minutes, further attempts from that address are summarised into a single “flood” event rather than stored one by one, so a brute-force run shows as 30 and a high-severity event, not as thousands.
The first three tiles are links, and each opens the log on the same period. Events opens the log, High or critical opens it filtered to those two severities, and Failed sign-ins opens the sign-ins group filtered to failed attempts. The number of events the log then shows is the number on the tile. The rows under Most active users and Top IP addresses, and both View all links, carry the period the same way.
Events per day
One pair of bars per day: all events, and the high or critical ones beside them. The serious bar is drawn separately on purpose - on a busy site it would be an invisible sliver on top of a stacked bar.
Days are days in the site’s timezone, as set under Settings, General in WordPress, and a day with nothing recorded is drawn as zero rather than left out. A gap in the chart is a quiet day, not missing data.
View all goes to the activity log.
By severity
How the period splits across informational, low, medium, high and critical. All five rows are always there, in that order, so the chart keeps its shape whether or not anything critical happened.
Failed sign-ins are medium, so a medium bar that grows overnight while the others stay put is often somebody guessing passwords.
Most active users and top IP addresses
Most active users lists the five signed-in users with the most events, and Top IP addresses the five addresses with the most. Each row is a link into the log, filtered to that user or that address.
The two lists answer different questions. A user at the top is somebody working. An address at the top that belongs to nobody on the first list is worth a look: it is activity with no account behind it.
With IP location PRO switched on, the log you land on shows where each address is. See IP Location.
Recent high-severity events
The eight newest events of high or critical severity in the period, each with who did it and how long ago. Clicking one opens it in the log’s inspector. View all opens the log filtered to high and critical.
When there are none, the card says Nothing serious in this period, which is the answer you want.
The numbers are up to a minute old
The dashboard is often the first screen opened, on a table that may hold millions of rows. Every figure is bounded by the period and answered from an index, and the result is kept for 60 seconds. Something that happened ten seconds ago may not be in the totals yet; it is already in the log.
On a WordPress network, a site administrator’s dashboard covers their own site only. A super admin sees the whole network.
The WordPress dashboard widget
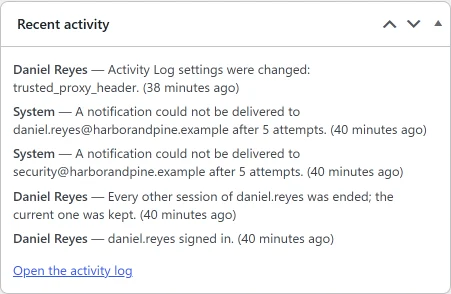
Separately from this screen, a Recent activity panel appears on WordPress’s own dashboard for everybody who may see the log. It lists the last five events with a link to the log.
Troubleshooting
| Symptom | Usual cause |
|---|---|
| Everything is zero on a new install | Nothing has been recorded yet. Sign out and in again and it will not be. |
| A total has not moved after something happened | Figures are kept for up to a minute. |
| The log shows more rows than the Events tile | The date filter was cleared after the tile was clicked. The tile counts the period; the log without a date shows everything kept. |
| Active users is lower than expected | It counts signed-in users. Visitors and excluded users are not in it. |
| A user appears by their username | The account has been deleted, so the login recorded at the time is all there is. |
| The chart’s last bar is short | Today is not over. |
| The screen shows a loading error instead of figures | Dashboard was switched off on the Monitors screen, so its figures are no longer served. Switch it back on. |
What to do next
- Read the detail: The Activity Log.
- Keep a filter you use every day: Saved Views.
- Be told instead of looking: Notifications.
- Get the same summary by email: Reports PRO.