

Contents
Analytics - Plugixa Easy Social Share Buttons
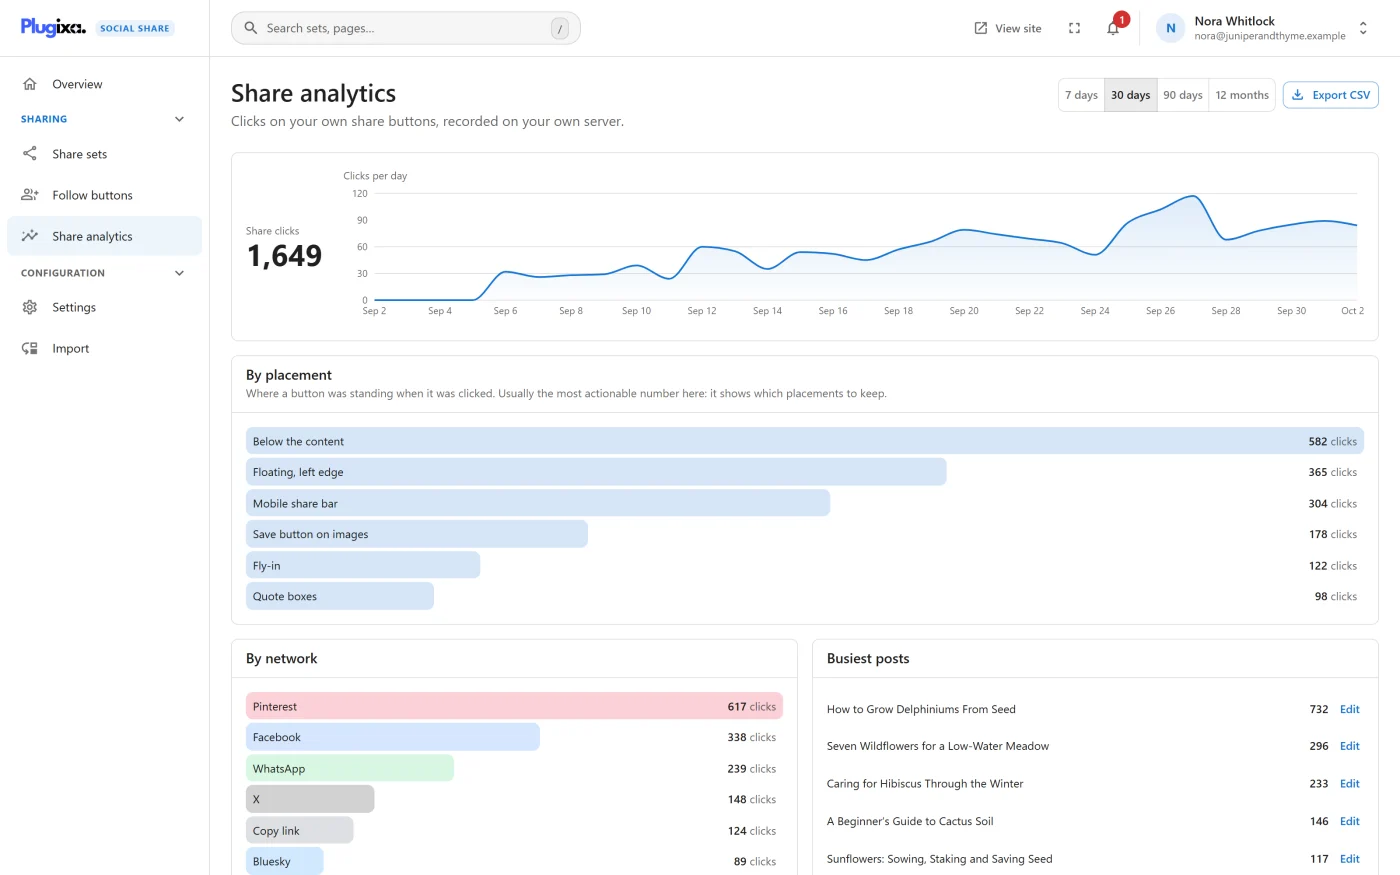
Plugixa Social Share -> Share analytics shows which networks and posts your visitors actually share from: “Clicks on your own share buttons, recorded on your own server.”
What is recorded
Each time a visitor clicks a share button, the plugin adds one to a daily tally for that post, network and placement. That is all: “Counted on your server. No visitor is identified, no IP address is stored, and nothing is sent anywhere.”
- Recording starts when the plugin is installed. Nothing is backfilled.
- A click is recorded by the plugin’s script, on a published post. Rows made only of plain links load no script and record nothing. See Share counts.
- Clicks on follow buttons are not recorded.
- To stop a script inflating the numbers, clicks from one address are limited to 60 a minute, and a click naming a network or placement the plugin does not know is discarded.
The free dashboard
Choose a range with the switch at the top: 7 days or 30 days. The switch stays in place while a range loads.
| Panel | What it shows |
|---|---|
| Share clicks | The total for the range |
| Clicks per day | A chart, one point per day |
| By network | Clicks for each network, busiest first |
| Busiest posts | The ten posts whose buttons were clicked most, each with an Edit link |
Before any click has been recorded the screen says “No clicks recorded yet” and explains that numbers appear once visitors start using your share buttons. A range with nothing in it reads “Nothing in this period.”
The Overview screen shows the same figures for the last 30 days, with the rise or fall against the 30 days before.
The Pro reports PRO
Pro adds to the same screen. Nothing in the free dashboard changes.
Longer ranges
Two more choices on the range switch: 90 days and 12 months.
By placement
A By placement panel: “Where a button was standing when it was clicked. Usually the most actionable number here: it shows which placements to keep.”
Every click has carried its placement since the plugin was installed, in both editions, so the panel has history from the first day, not from the day Pro was added.
| Placement shown | What it is |
|---|---|
| A spot’s name, such as Below the content or Floating, left edge | An automatic placement |
| Popup, Fly-in | The Pro overlay spots |
| Shortcode or block | A set placed by hand |
| Save button on images | The Pinterest Save button |
| Quote boxes | A quote box’s own share row |
| Unrecorded | A click that arrived with no placement |
Export CSV
Export CSV, beside the range switch, downloads one file per table for the range on screen:
| Menu item | Columns |
|---|---|
| Clicks per day | day, clicks |
| Clicks by network | network, name, clicks |
| Clicks by placement | placement, name, clicks |
| Busiest posts | post_id, title, clicks |
Files are named like share-clicks-networks-30d-2026-09-25.csv: the table, the
range, and the date it was taken.
- Column names are the same in every language, so another tool can import the file.
- A post title that looks like a spreadsheet formula is written as plain text.
- The file is made in your browser from the figures already on screen. There is no export address on the server.
The Export CSV button is shown to users with the
plugixa_social_share_export capability. Administrators have it.
Who can see the screen
The screen and its figures need the plugixa_social_share_view capability.
There is no public access to any of it.
Sending shares to Google Analytics
The click record above stays on your server. To see shares in Google Analytics 4 as well, switch on GA4 events. See Google Analytics and UTM.
What to do next
- Understand the numbers beside the buttons: Share counts.
- Act on the placement report: Placements.