

Contents
Analytics - Plugixa Chat
The plugin counts how often your widgets are seen, opened and used. The figures are shown on the Dashboard. They are counted on your own site and stored in your own database. Nothing is sent to Plugixa or to any outside service.
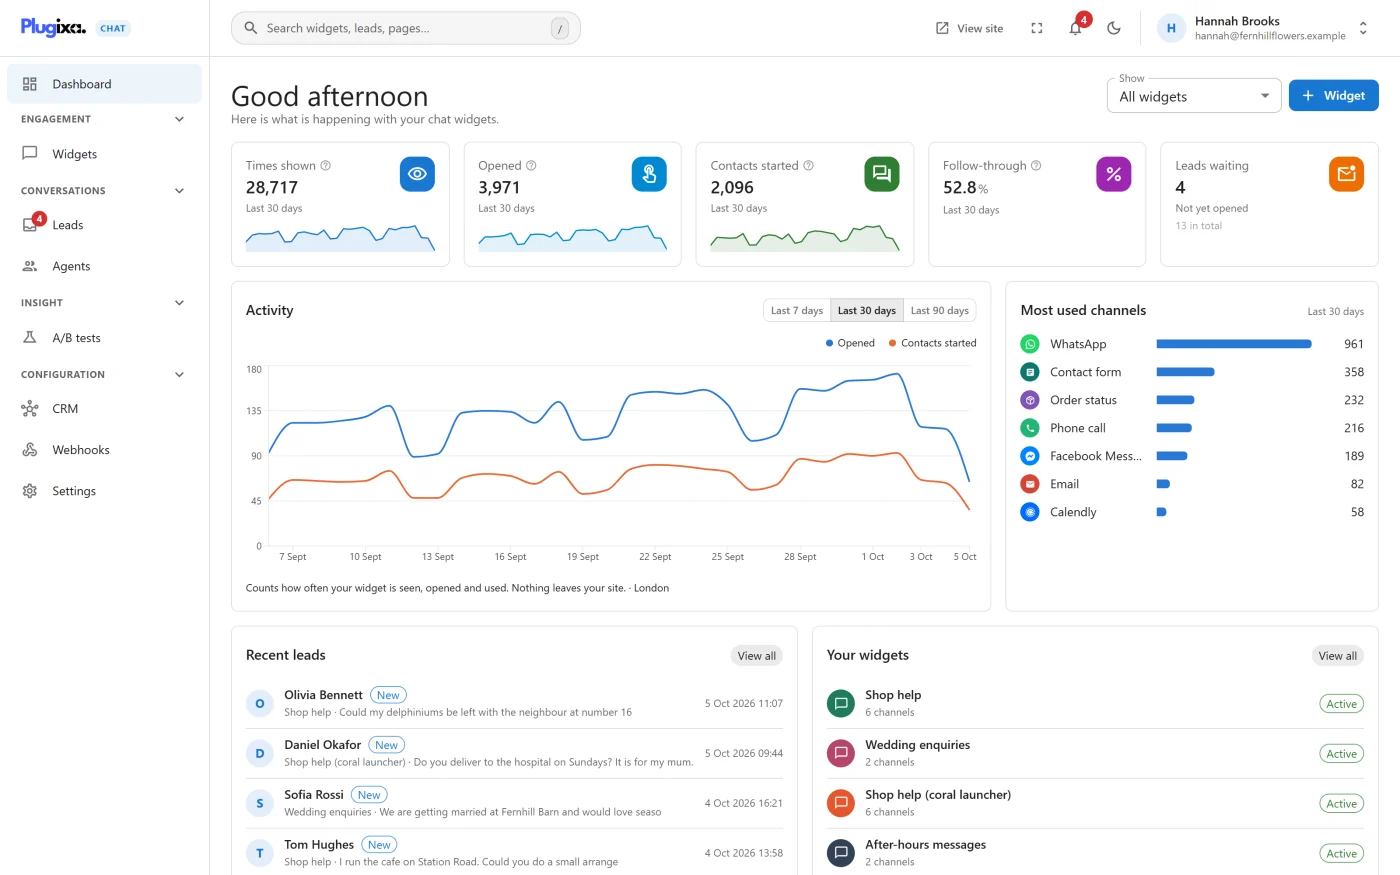
Analytics has no screen of its own. The Dashboard is where you read it.
What is counted
| Event | Counted when | Dashboard name |
|---|---|---|
| View | A widget becomes visible on a page: after its rules have passed and its trigger, if it has one, has fired | Times shown |
| Open | The list of channels opens: the visitor pressed the launcher, pointed at a widget set to open on hover, or the widget is set to be always open | Opened |
| Click | The visitor presses a channel. This includes a channel that opens a panel, a chat button in your content, and the WooCommerce product button | Contacts started |
Follow-through is clicks divided by opens, as a percentage.
A widget that a rule hides from a visitor is not counted as shown to them.
How it is recorded
- The widget notes each event in the visitor’s browser as it happens.
- When the visitor leaves the page, or switches away from the tab, the browser sends the noted events to your site in one small request.
- Your site adds them to hourly totals.
Because the events are sent together when the page is left, a figure can take a little while to appear on the Dashboard.
What is stored
One row per widget, channel, kind of event and hour, holding a number.
| Stored | Not stored |
|---|---|
| The widget | The visitor’s IP address |
| The channel, for clicks | Any cookie or visitor identifier |
| View, open or click | The page address |
| The hour | The browser or device |
| How many times |
There is no row per visitor and nothing that could identify one.
Limits that protect the figures
| Limit | Value |
|---|---|
| Requests one visitor can send | 60 every five minutes |
| Events in one request | 200 |
Requests must also carry a token that your site printed into the page and come from your own site. These checks stop somebody scripting fake clicks into your figures. See Privacy and uninstall for the short-lived record the limit uses.
Reading the figures
| Card | Detail |
|---|---|
| The tiles | Totals for the chosen period |
| Activity | One point per day, for 7, 30 or 90 days |
| Most used channels | Up to ten channels, by clicks |
Totals are grouped into days using UTC.
In Pro, the Dashboard can be narrowed to one widget. See Dashboard filter and dark mode PRO.
How long figures are kept
By default, indefinitely.
The setting Settings -> Privacy -> Delete leads and closed conversations after applies to analytics as well: when it is set to a number of days, figures older than that are deleted once a day, together with leads of the same age. With 0, nothing is deleted. See Settings.
Analytics and page caches
The counting works on cached pages. The token a page carries is valid for between 12 and 24 hours. A page served from a cache for longer than that still shows the widget and its links still work, but the events from that copy are refused and not counted. If your cache keeps pages for longer than a day, set it to refresh them at least daily.
Your own analytics tools
The Dashboard figures are separate from Google Analytics, Tag Manager and the Meta Pixel. To see widget activity in those tools as well, see Tracking events.
What to do next
- Read the screen in Dashboard.
- Send the same events to your own tags with Tracking events.
- Compare two widgets with A/B tests PRO.