

Contents
Spreadsheet Import - Plugixa Image Map
PRO If your hotspots already live in a spreadsheet, such as a list of exhibitors and their stands, import them instead of drawing each one.
Open Plugixa Image Map, choose Import & export in the plugin’s sidebar and find Import hotspots from a spreadsheet.
The file
A CSV file with one hotspot per row. The first row names the columns.
| Column | Required | Meaning |
|---|---|---|
x |
Yes | Horizontal position, in percent of the picture, of the hotspot’s centre. |
y |
Yes | Vertical position, in percent, of its centre. |
name |
No | The hotspot’s name. |
type |
No | spot, rect or oval. Without it, a spot. |
width, height |
No | The size of a rectangle or oval, in percent. |
tooltip |
No | The tooltip text. |
link |
No | A full web address, starting with https:// or http://. |
category |
No | Hotspots with the same category are put in one group. Upper and lower case do not matter. |
name,x,y,type,width,height,tooltip,link,category
A1 Aurora Labs,25.31,20.5,rect,9.38,11,Washable sensors for clothing,https://example.com/a1,Technology
Information desk,50,85,spot,,,Maps and lost property,,Services
Download an example gives you a file to start from.
Other names for the columns
Column names may be in upper or lower case, and a few other spellings are read as the same column. If two columns in one file mean the same thing, the first one is used.
| Column | Also accepted |
|---|---|
name |
title, label |
type |
shape |
width |
w |
height |
h |
tooltip |
description, text |
link |
url |
category |
group |
Files from any spreadsheet
Files saved by Excel or Numbers in European settings are read as they are:
semicolons or tabs between columns (whichever the first row uses), decimal commas (12,5), a percent sign after the
number (80 %), and the invisible marker Excel puts at the start of a file. A
quoted cell may contain commas and line breaks.
Importing
- Click Choose a CSV file.
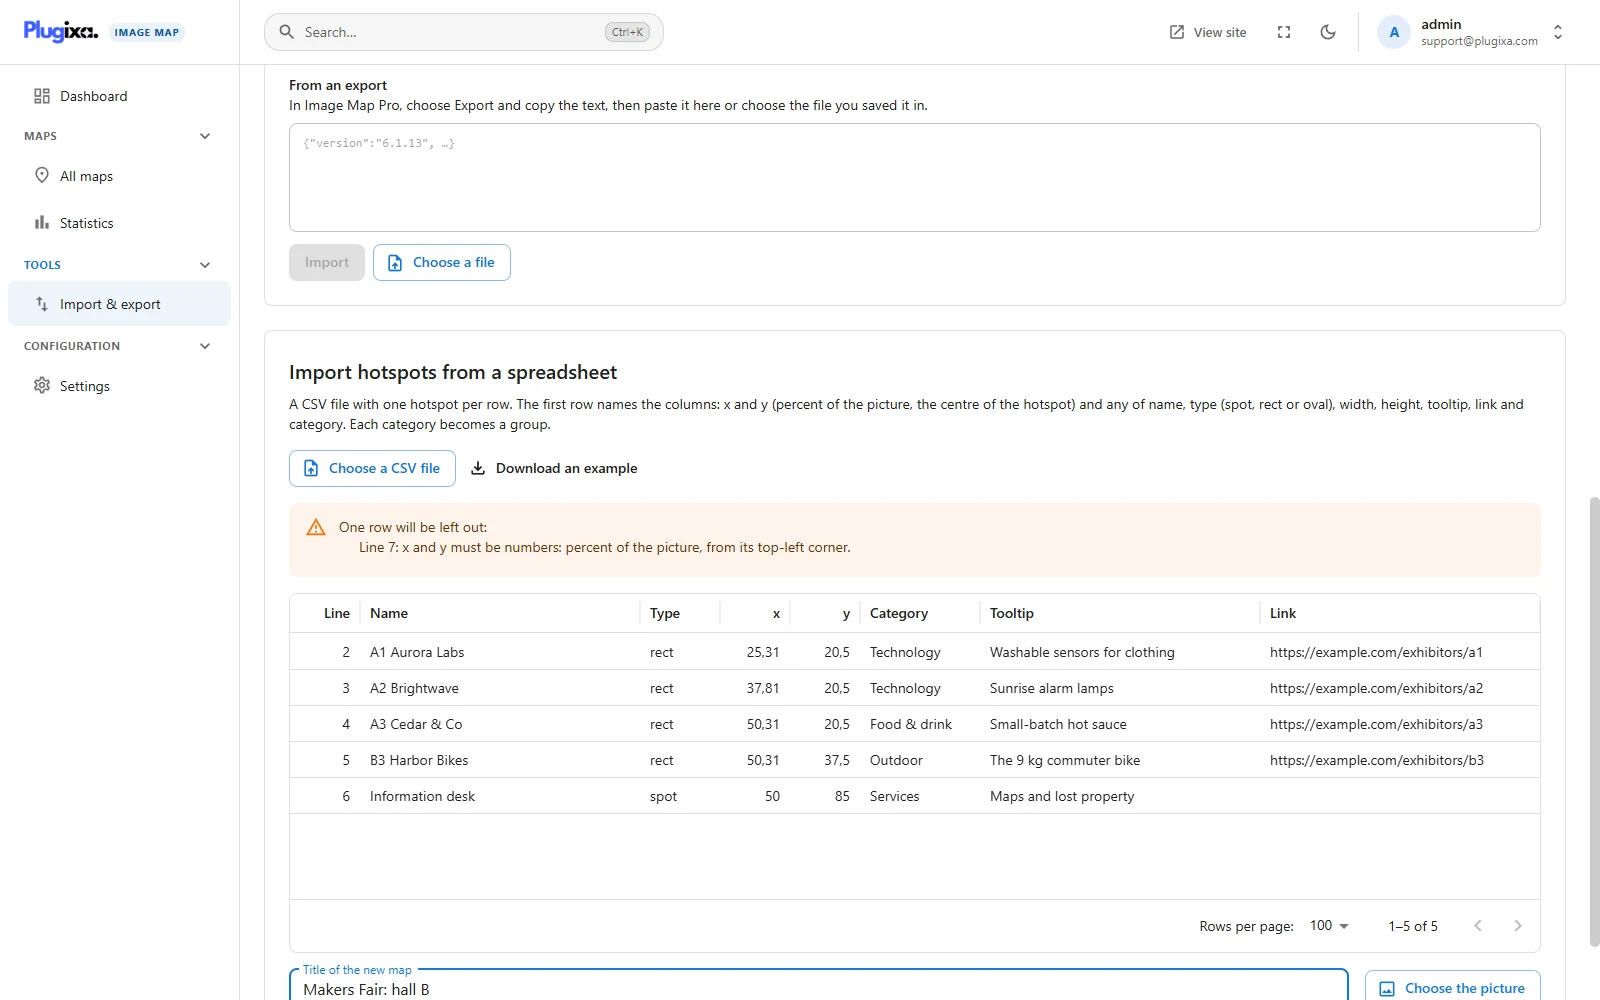
- Check the preview. Rows that cannot be used are listed by line number with the reason, for example x and y must be numbers. Columns the importer does not know are named and ignored.
- Type a Title of the new map and Choose the picture.
- Click Import. The button says how many hotspots will be made.
The result is a new draft map. Open it, check the positions against the picture, style the hotspots, then publish.
Limits
| Limit | Value |
|---|---|
| File size | 1 MB. A larger file is refused with a message asking you to split it. |
| Rows | 2,000, the most hotspots one map holds. Rows after that are left out and reported. |
From the command line
wp plugixa-image-map import-csv stands.csv --image=42 --title="Hall A" --user=admin
| Option | Meaning |
|---|---|
<file> |
The CSV file to read. |
--image=<id> |
Required. The attachment id of the picture in the media library. |
--title=<title> |
The new map’s title. |
--porcelain |
Print only the new map’s id. |
The user needs the import and create permissions. Each row that is left out is printed as a warning with its line number. See WP-CLI.
What the importer will not do
- Add to a map that already exists. Each import makes a new map.
- Keep a row with a link that is not a full web address. It is reported and left out, and the other rows are imported.
- Run anything. Tooltip text is cleaned exactly as it is in the editor.
Finding the percentages
Percent of the picture from its top-left corner: a point halfway across and a
quarter of the way down is x = 50, y = 25. If your spreadsheet has pixel
positions, divide by the picture’s width or height and multiply by 100.