

Contents
Statistics - Plugixa Image Map
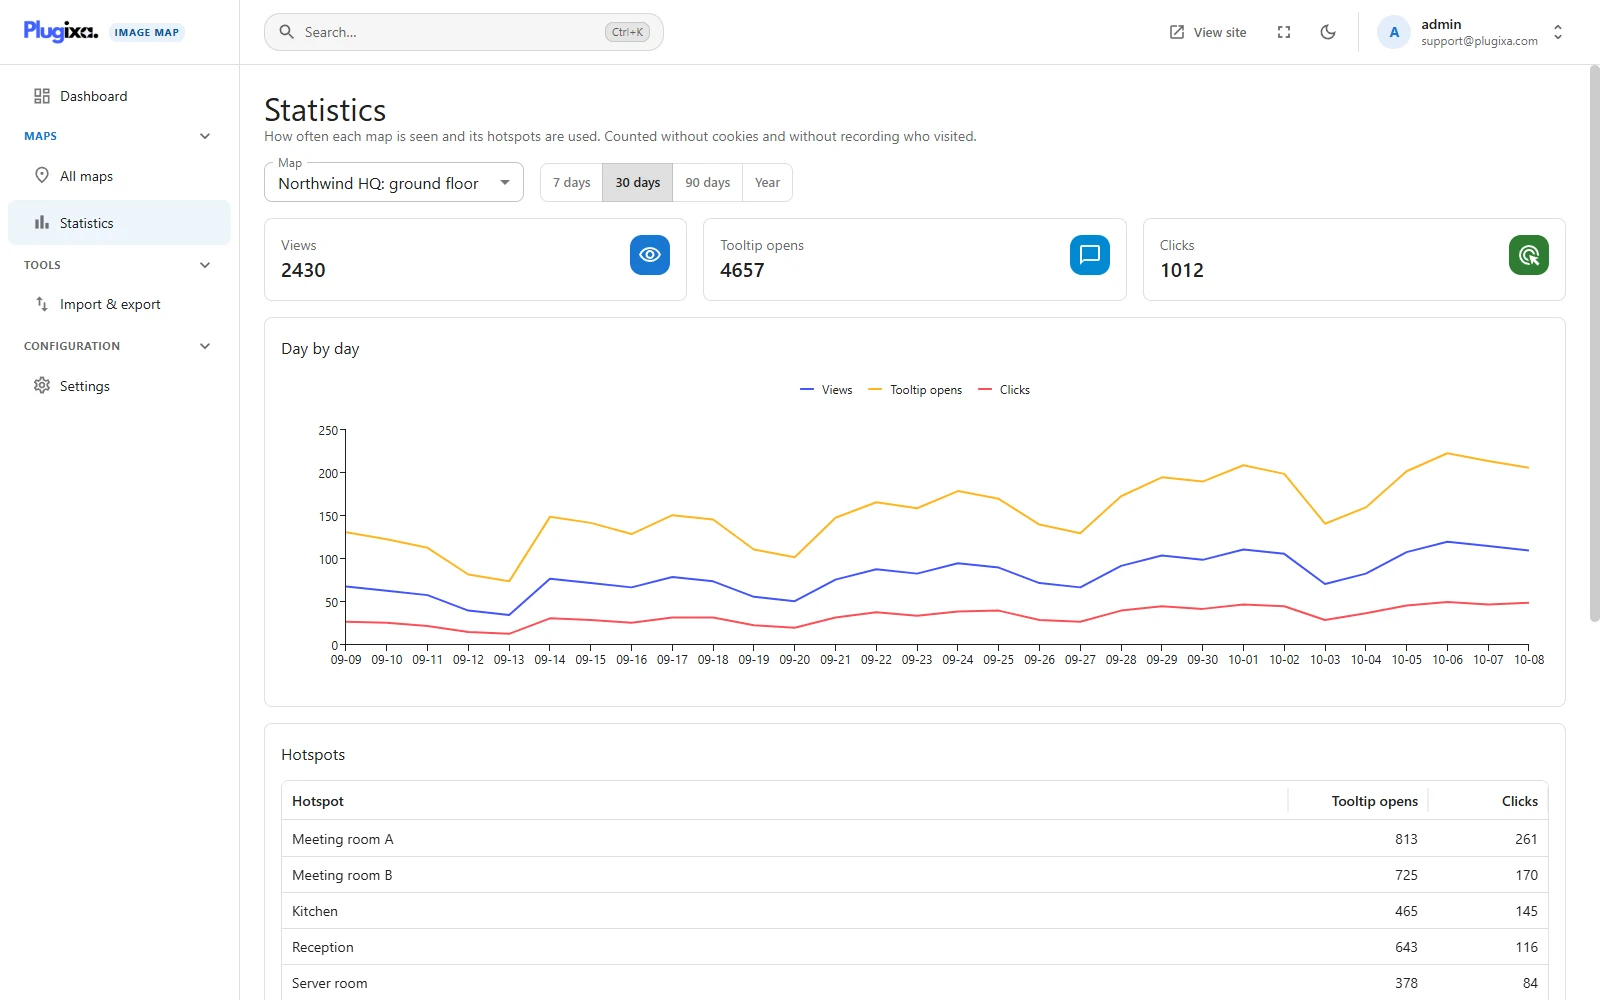
PRO Statistics, in the sidebar of Plugixa Image Map, shows how your maps are used.
What is counted
| Number | Counted when |
|---|---|
| Views | At least half of the map is on the visitor’s screen. Counted once per map per page load, so a map far down a page nobody scrolls to is not a view. |
| Tooltip opens | A visitor opens a hotspot’s tooltip. Counted once per hotspot per page load. |
| Clicks | A visitor clicks a hotspot that has a link or an action. |
Choose a Map and a period: 7, 30 or 90 days, or a year.
- Day by day charts the three numbers.
- Hotspots lists each hotspot’s tooltip opens and clicks, so you can see which rooms, stores or stands people care about. A hotspot deleted since is marked (removed).
Only published maps are counted.
How it is counted, and what is not stored
The numbers are totals per map, per hotspot, per day. Nothing else is kept.
| Cookies | None. |
| Who visited | Not recorded. No IP address, no user id, no browser details are stored with the counts. |
| Do Not Track / Global Privacy Control | A browser that sends either is not counted at all. |
| Other sites | Nothing is sent anywhere but your own site. |
Because there are no cookies, the same person on two days counts twice. Treat the numbers as a measure of interest, not a head count.
Limits that keep the numbers honest
Counts are sent by the visitor’s browser, so the plugin limits what one browser can add.
| Limit | Value |
|---|---|
| Requests | 20 a minute from one address. Beyond that the answer is 429 Too many requests and nothing is counted. The address is only used for this limit and is never stored with the counts. |
| One counter in one request | Raised by 20 at most. |
| Hotspots in one request | 200 at most. |
Hotspots that are not on the map are ignored.
Who can see statistics
Anyone who may view maps. See Roles and permissions.
Caching
Statistics work behind a page cache and a CDN. The script that reports the counts is loaded only on pages with a map.