

Contents
Dashboard - Plugixa Inventory
The dashboard is the landing screen. It answers four questions: what is it worth, what has been happening, what is about to run out, and where is it.
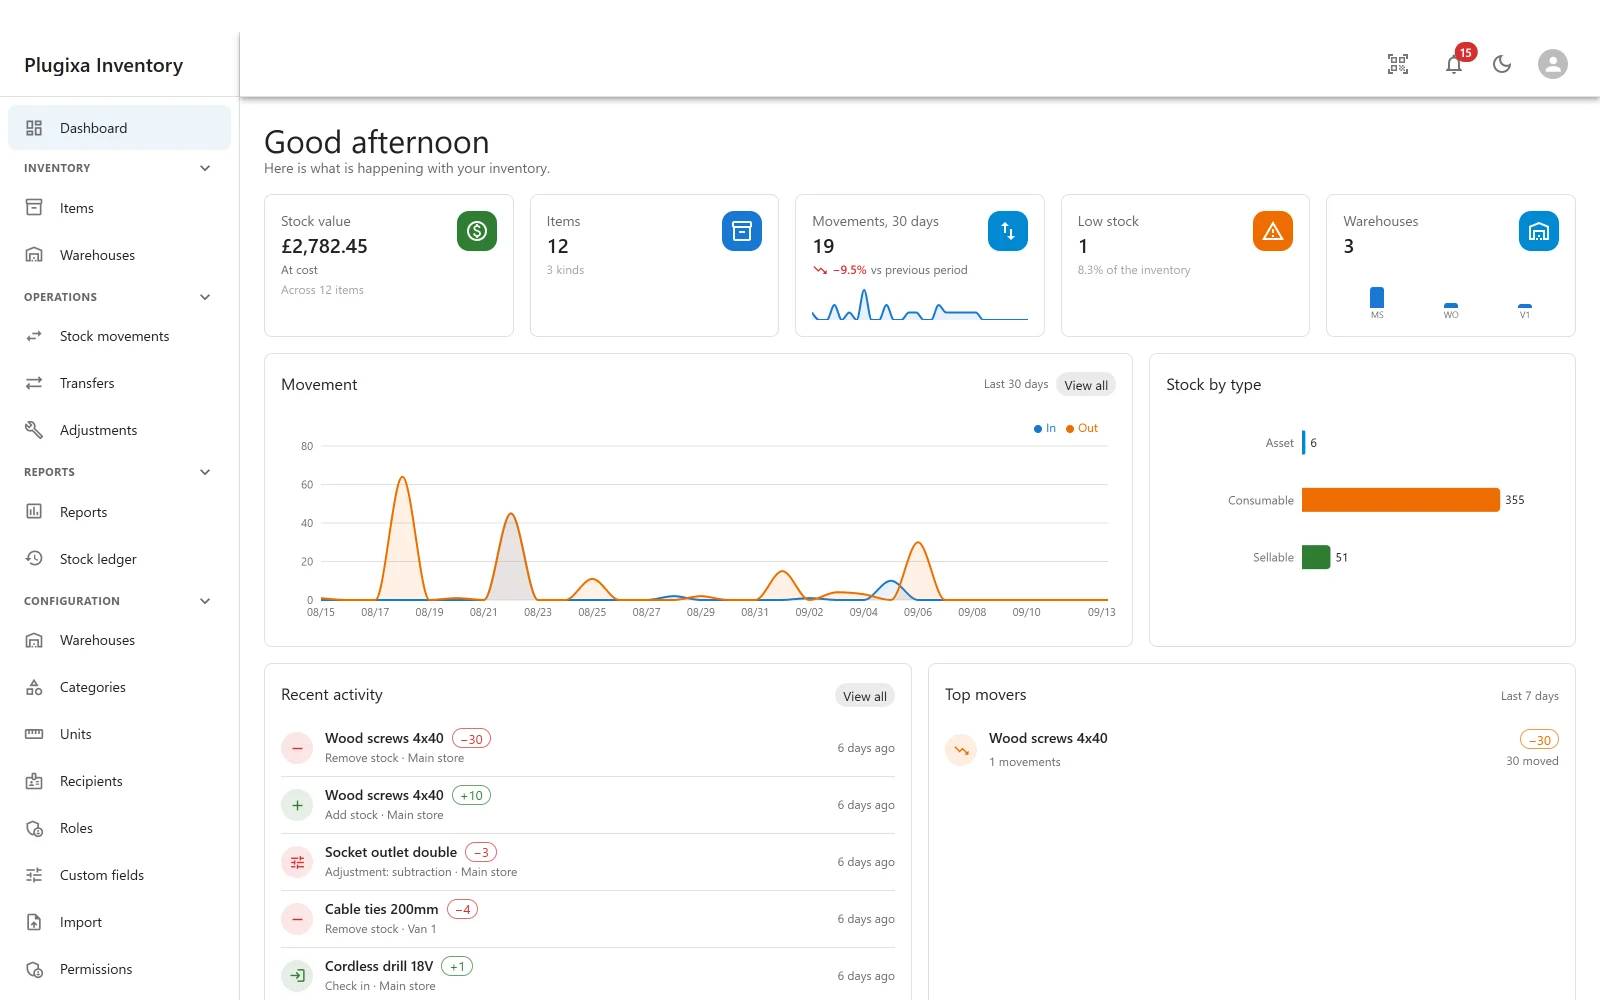
The top row
| Card | What it counts |
|---|---|
| Stock value | Everything on hand, at cost, across every warehouse |
| Items | How many items hold stock, and how many kinds they are |
| Movements, 30 days | How many documents were finalised, against the previous 30 days |
| Low stock | Items at or below their reorder level, as a share of the catalogue |
| Warehouses | How many locations, with a bar each so you can see the split |
At cost is the important word. Stock value uses the cost price, not the sale price, because what you hold is worth what you paid for it. An item with an empty cost price falls back to its sale price, which overstates the total by your whole margin - so an unexpectedly large number usually means a cost price is missing rather than that you are rich. See Valuation and Costing.
The movement card’s percentage compares the last 30 days with the 30 before it. On a new site it will be dramatic in both directions for a while, which is arithmetic rather than a signal.
Movement
Stock in and stock out, day by day, for the last 30 days. The two lines are separate on purpose: a day with a big delivery and a big issue is a busy day, and a net figure would show it as a quiet one.
View all goes to the stock ledger, which is the same data without the smoothing.
Stock by type
Quantity held, split by asset, consumable and sellable. It is a quick sanity check on the catalogue: a business that thinks it mostly holds assets and sees a consumable bar ten times longer has usually mis-typed a few items.
Recent activity and top movers
Recent activity is the last few ledger rows, each with the item, what happened, how much, where, and when. It is the fastest way to answer “what did somebody just do”.
Top movers ranks the last seven days by how much quantity moved, in either direction. Something at the top of that list either sells well or leaks, and both are worth knowing.
Everything here is derived
Not one number on this screen is stored. Stock value, the counts, the chart and the activity list are all computed from the ledger and the per-warehouse stock rows, so the dashboard cannot drift away from the underlying data - there is no second copy to get stale.
That also means the dashboard is honest about an empty site. A new install shows zeroes rather than a demo, and the numbers appear the moment you finalise your first document.
Low stock
An item is low when its on-hand quantity is at or below its reorder level. Leave the reorder level at zero and nothing is ever low, which is the right default for something you do not reorder.
The card counts them; Items lists them with the low stock filter; and Notifications can tell somebody without anybody having to look.
Troubleshooting
| Symptom | Usual cause |
|---|---|
| Everything is zero on a new install | Nothing has been finalised yet. A draft moves nothing. |
| Stock value is far higher than expected | Cost prices are missing, so those items fall back to the sale price. |
| An item is not counted in the value | It holds no stock, or it is trashed. |
| Low stock is always zero | No item has a reorder level above zero. |
| The movement percentage looks absurd | It compares two 30 day windows. With little history, both are small numbers. |
| Top movers is empty | Nothing moved in the last seven days. |
| The numbers disagree with a warehouse card | The dashboard totals every location. Open the warehouse for its own figures. |
What to do next
- Look at one location: Warehouse Overview.
- See the raw history: The Stock Ledger.
- Understand the value: Valuation and Costing.
- Go deeper: Reports PRO.