

Contents
Reports and analytics - Plugixa Inventory
The dashboard answers “how are we doing”. Reports answer “why”, and let you take the answer away as a CSV.
Pro feature. Reports are part of Plugixa Inventory Pro. See the Free vs Pro matrix.
Four tabs
| Tab | What it answers |
|---|---|
| Overview | What is it worth, split by category and by type, and what has been happening |
| Stock analysis | Which stock is working and which is sitting still |
| Transactions | What moved, in what direction, and what it cost |
| Low stock | What is about to run out, and by how much |
Overview
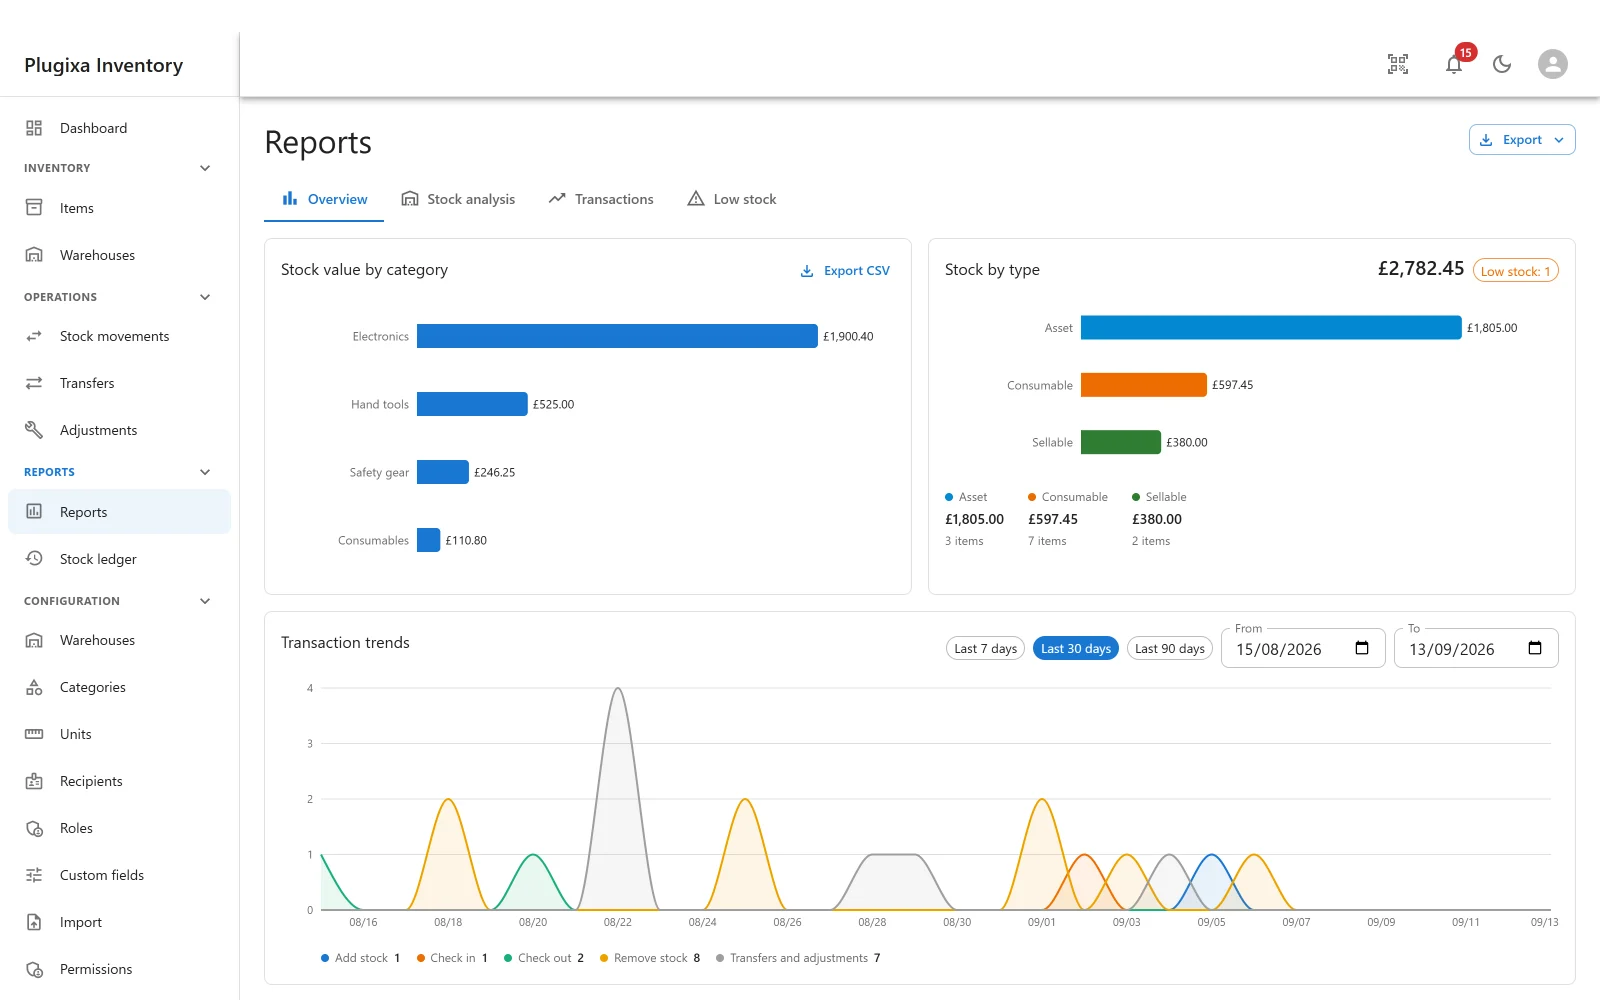
Stock value by category and stock by type are the two breakdowns of the same total. Both are at cost. Clicking a category drills into the items inside it, so a bar that looks wrong can be taken apart without leaving the page.
Transaction trends plots each movement type over time - add stock, check in, check out, remove stock, and transfers and adjustments together - with Last 7 days, Last 30 days, Last 90 days, Last 12 months or a From and To of your own.
The types are separate lines on purpose. A net figure hides a day when a large delivery and a large issue happened together, which is exactly the day worth looking at.
Stock analysis
Turnover is units moved for every unit held. Higher means stock is working harder. It is the number that separates a line you should order more of from one that has been on the shelf since the day it arrived.
Fastest moving and slowest moving rank the catalogue by it. The slow end is usually the more useful list: it is where money is sitting still.
Transactions
Movement and net change over the period, and cost of goods sold with the average cost per unit behind it.
Transfers between your own warehouses are excluded from cost of goods sold. Moving stock is not a cost. Including internal transfers would inflate the figure every time something crossed the yard.
Ageing
How long stock has been sitting, in buckets.
Ages are reconstructed from the stock ledger, by walking back through receipts until the on-hand quantity is accounted for. Where the ledger has no receipt on record for some units - stock that predates the plugin, or arrived without a document - those units are counted as oldest, and the report says how many they were rather than hiding them.
Switch on FIFO or LIFO costing for layer-accurate ageing, because then the layers are real rows rather than a reconstruction. See Valuation and Costing.
Low stock
Every item at or below its reorder level, with the shortfall - how far below it is - and which are out of stock entirely. Shortfall is the column to sort by when you are writing a purchase order.
Getting the numbers out
- Export CSV on a panel writes that panel.
- Export at the top offers Export inventory (CSV) and Export transactions (CSV) for the whole report, honouring the period you have selected.
- Print produces a clean page without the chrome.
Comparisons
Every period-based figure is shown against the previous period of the same length, so 30 days is compared with the 30 before it. On a young site both numbers are small and the percentage swings wildly. That is arithmetic, not a signal.
Troubleshooting
| Symptom | Usual cause |
|---|---|
| Reports is not in the menu | Pro module, or switched off in the App Manager. |
| “There is nothing to report yet” | Nothing has been finalised. A draft is not data. |
| Valuation is higher than expected | Cost prices are missing, so those items fall back to the sale price. |
| Ageing says units had no receipt on record | Stock that arrived before the ledger did. It is counted as oldest, and the note says how much. |
| Cost of goods sold looks low | Internal transfers are excluded, on purpose. |
| Turnover is zero for an item | It has not moved in the period. That is the finding. |
| A percentage looks absurd | It compares two equal windows. With little history, both are small. |
| The CSV is missing rows | It honours the period and any filter. Widen the range. |
What to do next
- The raw rows: The Stock Ledger.
- How value is calculated: Valuation and Costing.
- Export any list instead: Export.
- One location at a time: Warehouse Overview.