

Contents
Dashboards - Plugixa CRM
The dashboard is where the CRM opens. The top row is fixed and the rest is yours to arrange.
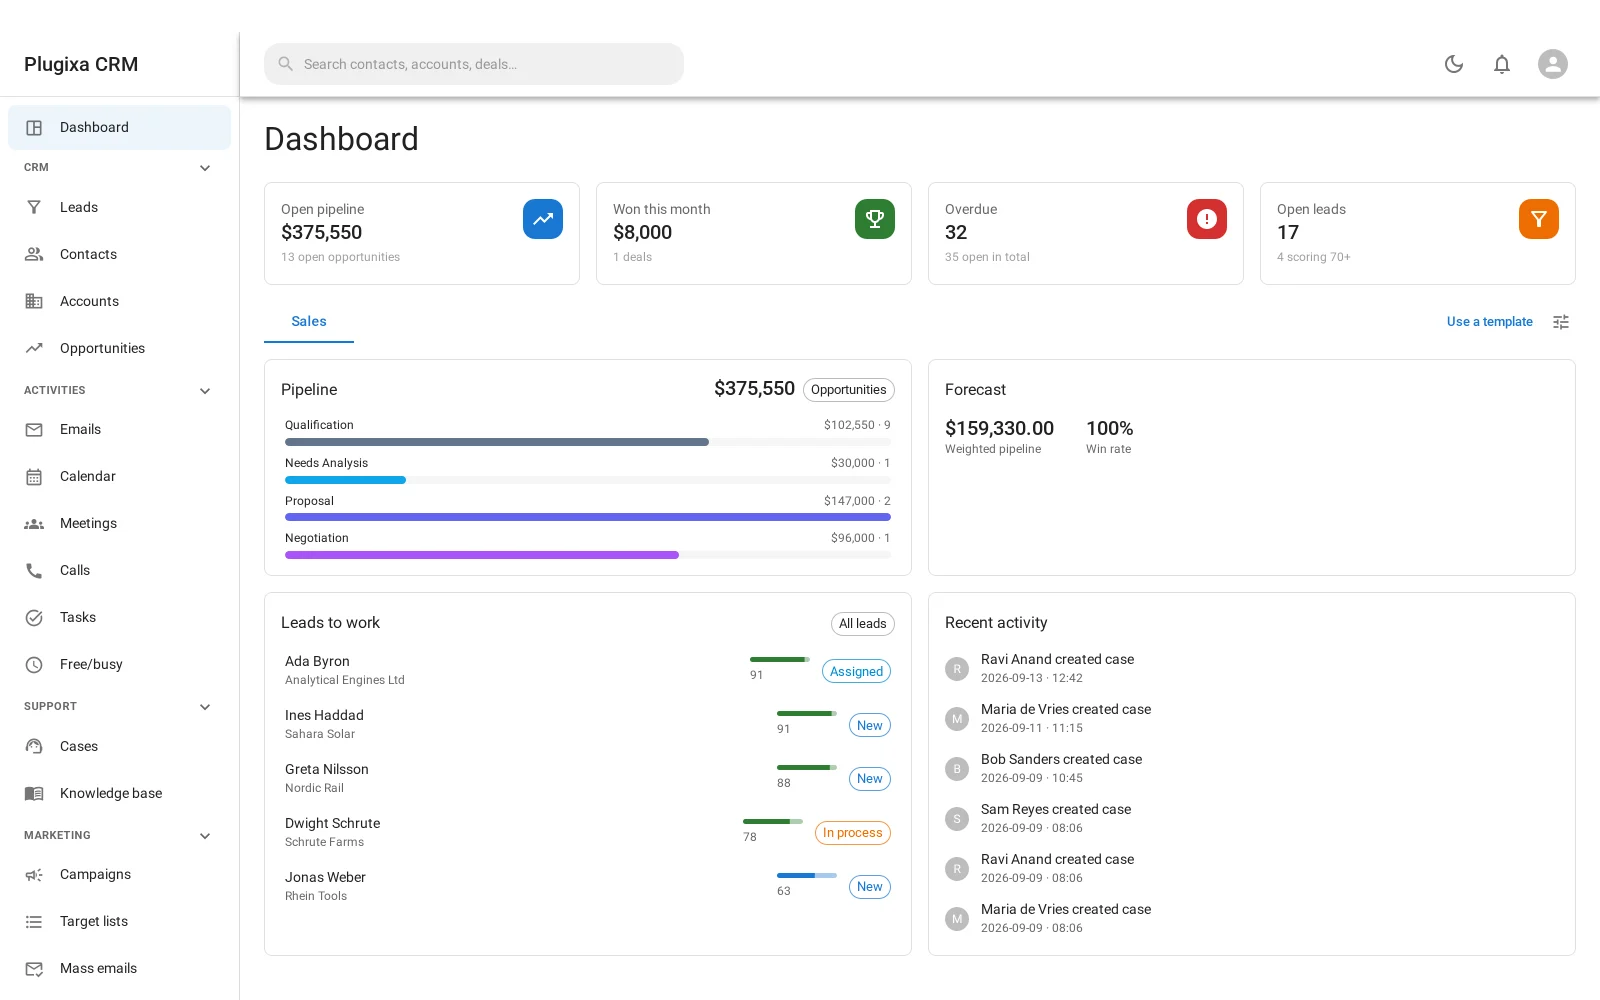
The four figures across the top
| Card | What it counts |
|---|---|
| Open pipeline | The total amount of every deal not yet won or lost, and how many there are |
| Won this month | Closed-won value this calendar month, and the number of deals |
| Overdue | Activities past their date, against how many are open in total |
| Open leads | Leads not yet converted, and how many score highly |
These are the numbers somebody wants before they have decided what to look at, so they are always there regardless of how the rest is arranged.
Widgets
Below the figures is a grid you control. The widgets that ship include:
- Pipeline - value and count per stage, as a bar per stage.
- Forecast - the weighted pipeline, and the win rate.
- Leads to work - the highest-scoring open leads, with their status.
- Recent activity - what has happened across the CRM, newest first.
Arrange them with the control at the top right of the tab. The arrangement is per person: yours does not change anybody else’s.
Tabs
A dashboard can have more than one tab, and that is the point of it. One for the pipeline, one for support, one for whatever this quarter is about.
Tabs are yours, like the arrangement.
Templates
Use a template seeds a new tab from a saved arrangement, so a new starter gets something sensible rather than an empty grid.
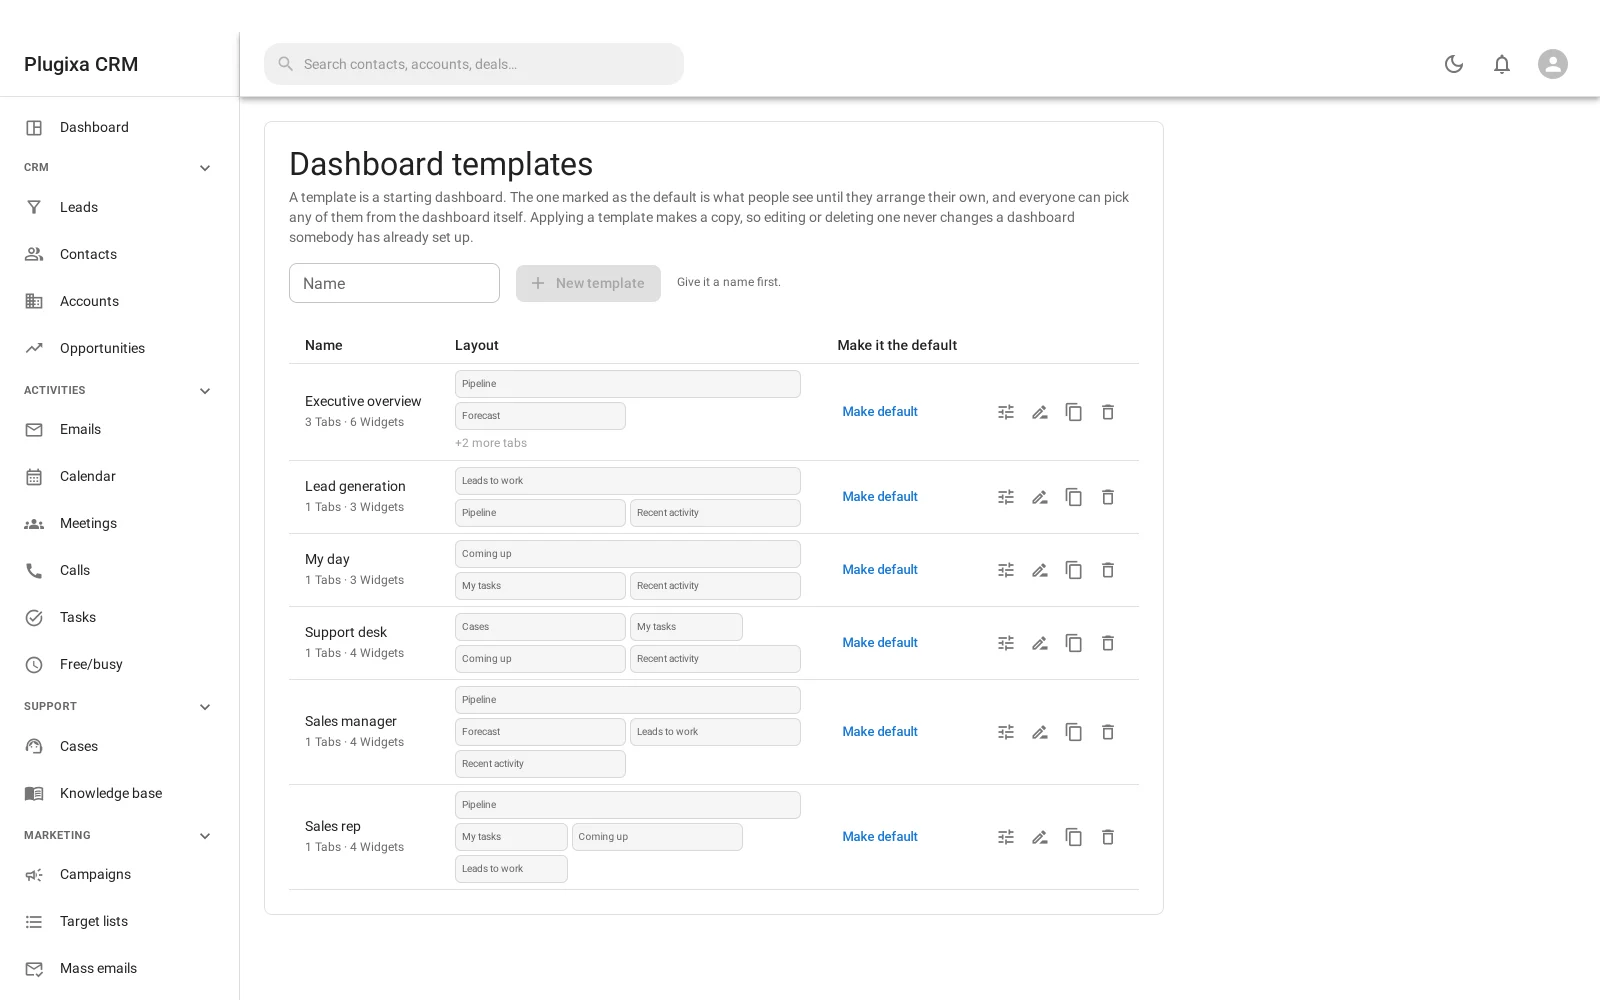
Templates are managed under Administration -> Dashboard templates. Authoring
one is a site-configuration job rather than record work, so it needs the
WordPress manage_options capability rather than an ordinary CRM role.
Dashboards are not reports
They answer different questions and it is worth keeping them apart:
| Dashboard | Report | |
|---|---|---|
| What it is | An arrangement of live widgets | A saved definition you run |
| Scope | Now, across the CRM | Whatever you defined, over whatever period |
| Who has it | Each person arranges their own | Saved and shared |
| Output | On screen | On screen, and exportable |
What you see depends on your role
Every figure obeys the same permission rules as the screens behind it. Somebody whose role scopes deals to own sees their own pipeline in the top row, not the company’s. That is the intended behaviour, and it is why two people can look at the same dashboard and disagree about the number.
Troubleshooting
| Symptom | Usual cause |
|---|---|
| My numbers differ from a colleague’s | Role scoping. Each of you sees what you may read. |
| Won this month is zero | No deal has moved into a winning stage this calendar month. |
| The pipeline widget is empty | Every deal is closed, or your role scopes them away. |
| Overdue counts something already done | An activity is past its date and not marked complete. |
| My arrangement vanished | Arrangements are per person and per tab. Check the tab. |
| I cannot save a template | Authoring templates needs manage_options, not a CRM role. |
| Recent activity says “Someone” | The record was created by something with no user attached, such as a seeder or an import. |
What to do next
- Work the deals: Opportunities.
- Ask a sharper question: Reports and Forecasting.
- Decide who sees what: Roles, Teams and Permissions.