

Contents
Reports and forecasting - Plugixa CRM
A report is a saved definition you run against your own data, rather than one of a fixed set somebody else chose.
Reports are free. They are a paid extension in several comparable systems, and some of this plugin’s own older code comments still describe this module as premium. Those comments are out of date. See Free vs Pro.
Building a report
Pick a source - the kind of record you are asking about - then narrow it, group it, and choose how to show it.
| Part | What it decides |
|---|---|
| Source | Which records the report is about |
| Filters | Which of them count |
| Grouping | What the rows or bars are |
| Measure | What is being counted or summed |
| Chart | How it is drawn, or whether it is a table |
Save it and it is there to run again. Preview runs it without saving, which is how you find the definition you actually wanted.
The forecast
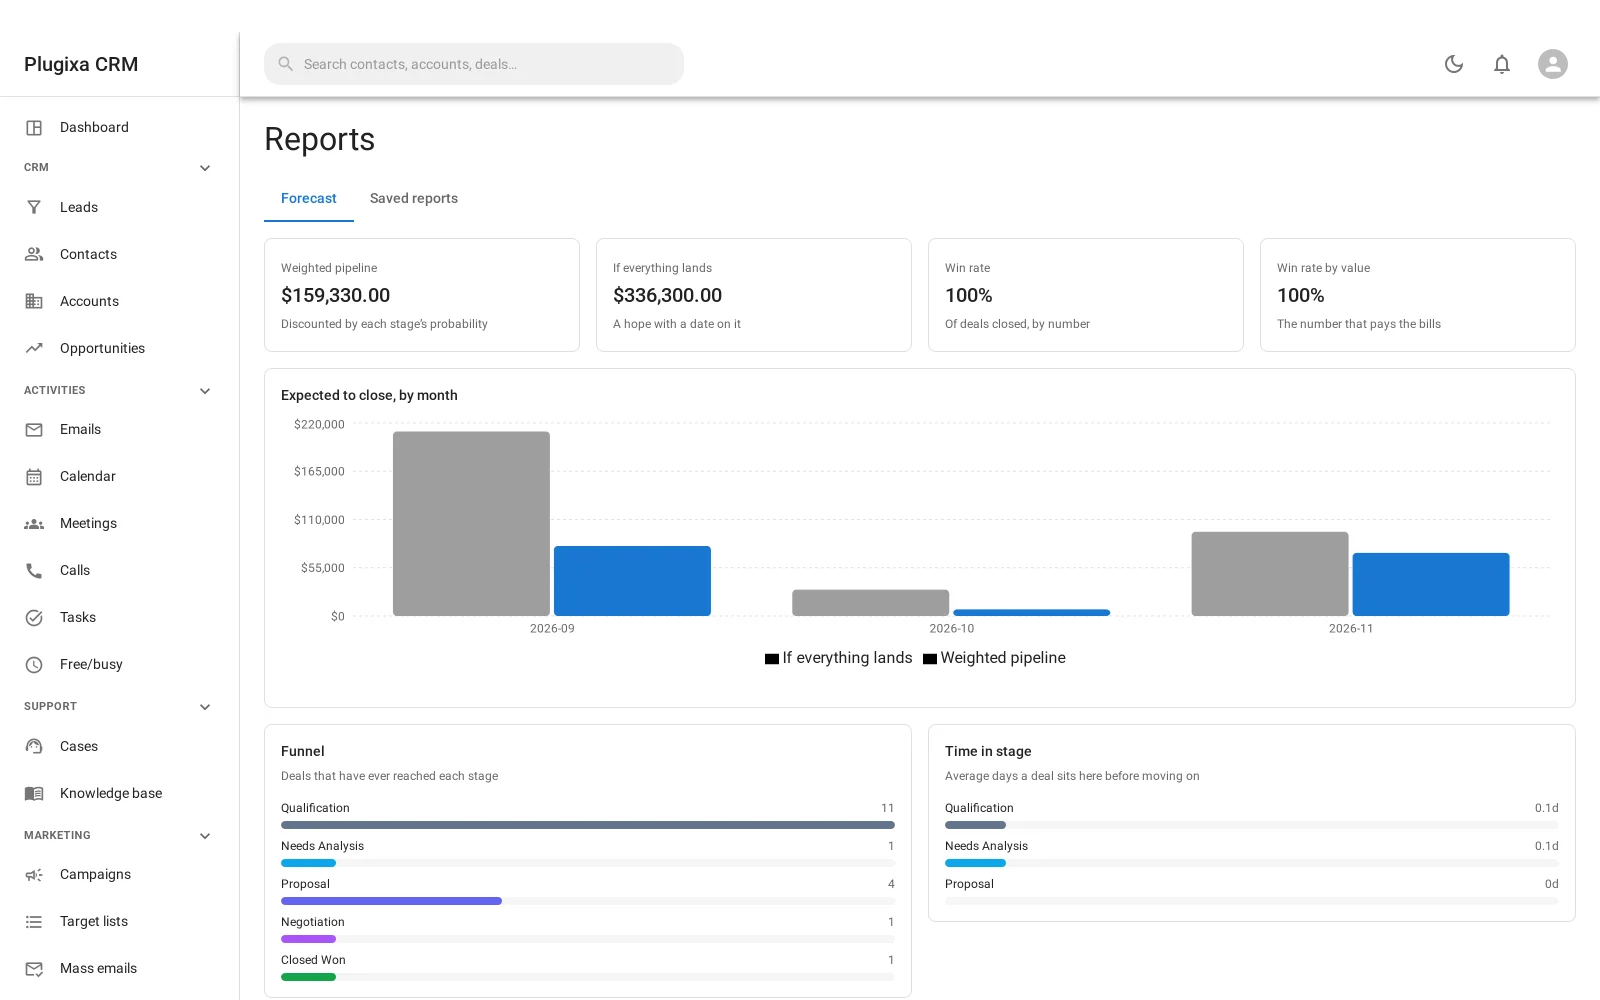
The forecast is not the total of everything open.
Each open deal is multiplied by the probability of the stage it is in, and those are added up. A pipeline of ten deals worth 10,000 each, all at 10%, forecasts 10,000 and not 100,000.
That is the number worth taking to a board meeting, and it is why stage probabilities are worth setting honestly. See Opportunities.
Stage history makes “where do deals stall” answerable
Every stage move records where the deal came from, where it went, what it was worth at the time, and how long it spent in the stage it left.
A snapshot of the pipeline tells you where deals are. That history tells you where they stop, which is the more useful question and the one most CRMs cannot answer.
Reports are not dashboards
| Dashboard | Report | |
|---|---|---|
| What | Live widgets you arrange | A definition you run |
| When | Now | Any period you defined |
| Whose | Each person arranges their own | Saved, and shared |
| Out | On screen | On screen and exportable |
What you see depends on your role
A report obeys the same permission rules as the screens. Somebody whose role scopes deals to their own sees their own pipeline in a report, not the company’s.
Two people running the same saved report can legitimately get different numbers, and that is the access model working rather than a bug.
Troubleshooting
| Symptom | Usual cause |
|---|---|
| My numbers differ from a colleague’s | Role scoping. Each of you sees what you may read. |
| The forecast is far below the pipeline | That is what weighted means. Check stage probabilities. |
| A report returns nothing | The filters exclude everything, or your role scopes the source away. |
| The chart is unreadable | Too many groups. Narrow the filter or group more coarsely. |
| A custom field is not available to group by | Reports do not read custom fields at all. Every dimension and measure is a key the report builder ships; custom fields are not among them, and marking one filterable does not add it. Export the list and group there. |
| Old deals are missing from a trend | They may be in the trash. Trashed records are excluded. |
| A comment in the code says this is premium | It is out of date. Reports is free. |
What to do next
- What it reports on: Opportunities.
- The at-a-glance view: Dashboards.
- Take the numbers away: Import and Export.