

Contents
On this page
Audience insights - Plugixa Video
Audience insights adds to the Analytics page: an Audience retention panel that shows where viewers leave a video and how often it stops to buffer, and an Export CSV button for the whole report. With the Payments app on, the page also shows your revenue per day.
Audience insights is an app in the App manager, “Audience insights: Where viewers leave each video, how often it buffers, and a CSV export of your analytics.” It is on by default in Pro and needs the Analytics app, which is part of Pro too and comes with its own page and figures.
Open Analytics in the admin app’s menu. The period buttons at the top (7 days, 30 days, 90 days, 365 days) apply to the retention panel and the export as well.
Audience retention
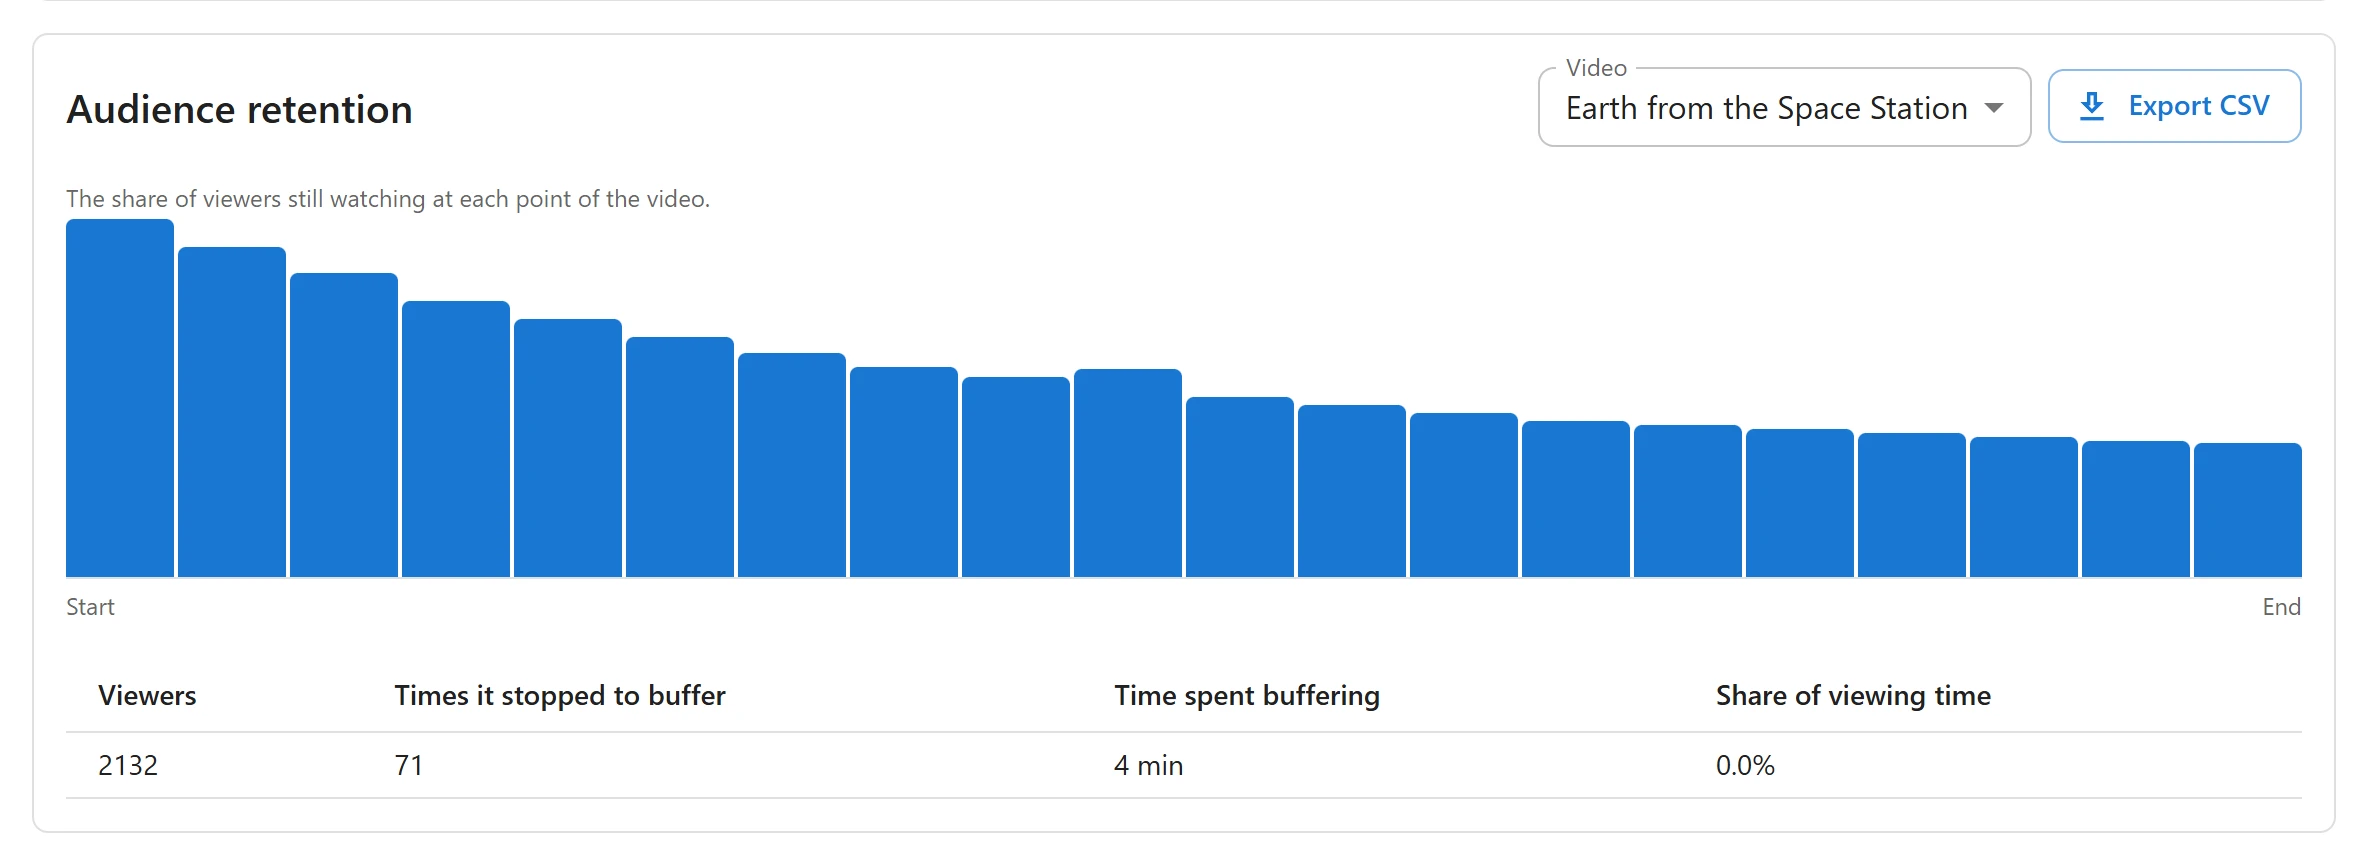
The panel sits under the main Analytics report.
- Pick a video in Video. The list holds the videos of the period’s Top videos that were played in the player.
- Read the bars from Start to End. The video is cut into 20 equal parts, and each bar is the share of viewers who watched that part. Hover over a bar, or reach it with the Tab key, to read the exact figure, for example “At 50% of the video: 64% (412)”.
A bar that drops sharply shows where viewers leave.
How viewers are counted:
- A viewer counts once per part per day, so watching a scene ten times does not make it look popular.
- Only parts that were really played count. Skipping ahead with the timeline does not mark the parts in between.
- Shares are measured against the most watched part, not the first one, because a link can open a video in the middle.
- Visits from known bots are ignored.
Retention is measured for videos played in the plugin’s own player. “Retention appears once someone has watched a self-hosted or linked video. YouTube and Vimeo do not report it.” For a video with nothing in the chosen period, the panel reads “Nothing measured for this video in this period yet.”
Buffering
Under the bars, a table reports playback quality for the same video and period:
| Column | What it shows |
|---|---|
| Viewers | The viewers of the most watched part |
| Times it stopped to buffer | How many times playback stopped to wait for data |
| Time spent buffering | The total waiting time |
| Share of viewing time | Waiting time as a share of watch time plus waiting time |
Only stops during playback count. The loading before the first frame and the wait after the viewer jumps to another point are left out. A high share on one video points to its source or renditions; see Uploading and encoding.
Revenue per day
With the Payments app on, the Analytics page adds a Revenue (USD) tile (with your currency code) beside Views and Watch time, and the same measure in the chart and table switch. It shows the money received each day of the period, from the earnings ledger.
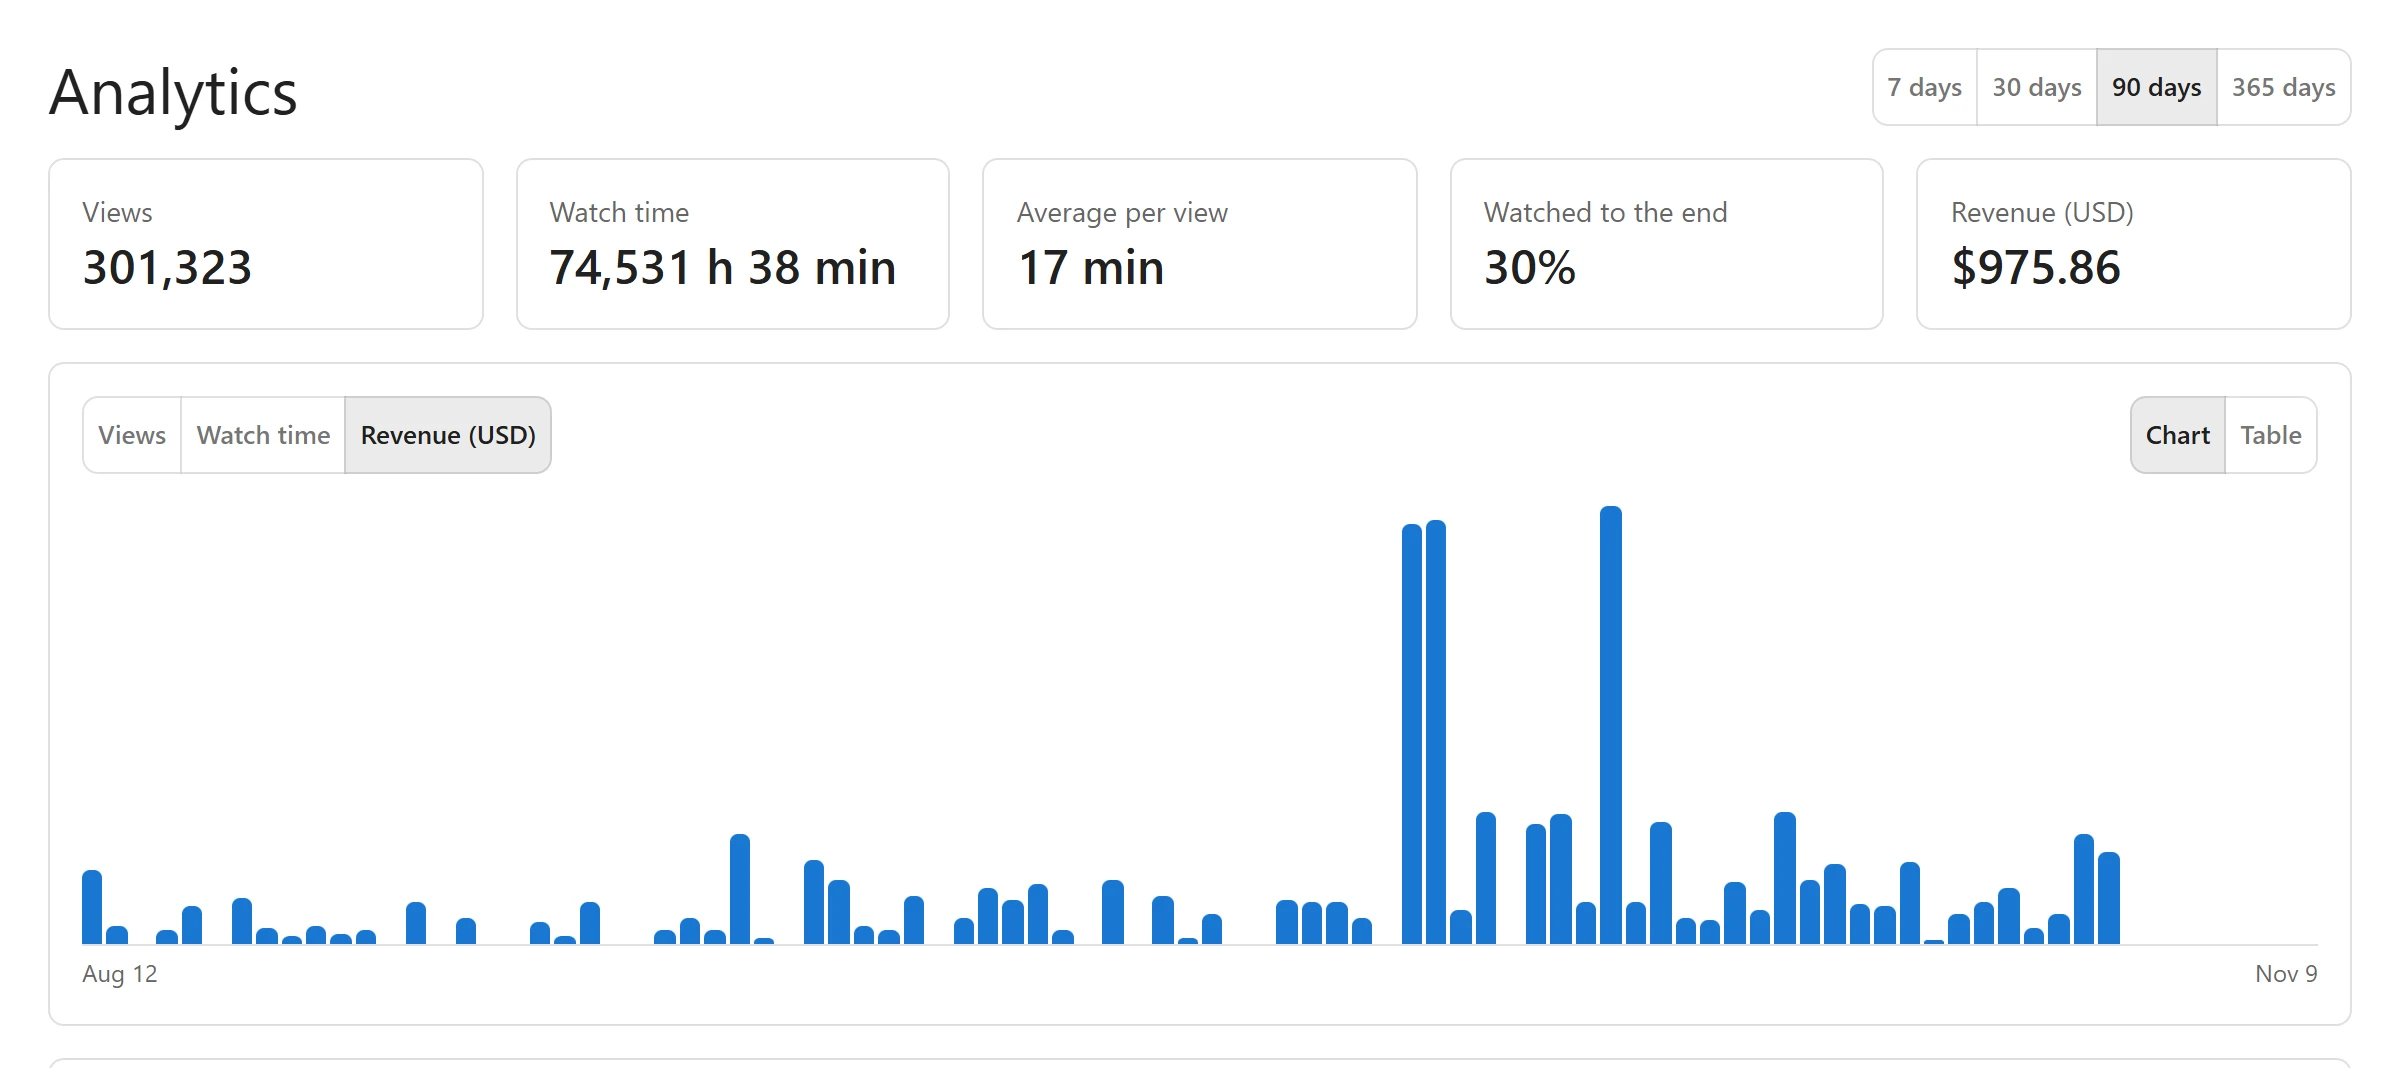
- Each currency gets its own measure: sums of different currencies would mean nothing.
- Refunds count on the day they were made, so a day can be negative.
- Amounts are what buyers paid, before any creator commission.
- A creator who sees only their own videos on Analytics also sees only the revenue of their own videos. Memberships are not part of a creator’s revenue.
Export CSV
Click Export CSV in the Audience retention panel to download the period’s analytics as
video-analytics-<days>-days-to-<date>.csv, one row per video and day, newest day first:
| Column | Content |
|---|---|
date |
The day |
video_id, title |
The video |
views, plays |
Views and plays that day |
watch_seconds |
Watch time in seconds |
finished |
Plays watched to the end |
stalls, stall_seconds |
Times it stopped to buffer, and for how long |
The file is built page by page, so a year on a busy site exports in full. It opens in Excel with accents and non-Latin titles intact. If something goes wrong, the panel reads “The export could not be made.”
Users who can edit other people’s videos export every video. A creator exports their own videos only.
Data kept
Retention and buffering are stored per video and per day, as counts. The list of what each viewer already counted for today is emptied every day.
Related
Quick Links
Share