

Contents
On this page
Dashboard - Plugixa Stream
The Dashboard is the first screen of the admin app: Plugixa Stream > Dashboard. It answers four questions in order: is anyone watching, what goes out next, what are they watching, and where do they stop or run into a problem. Viewing figures cover the last 30 days.
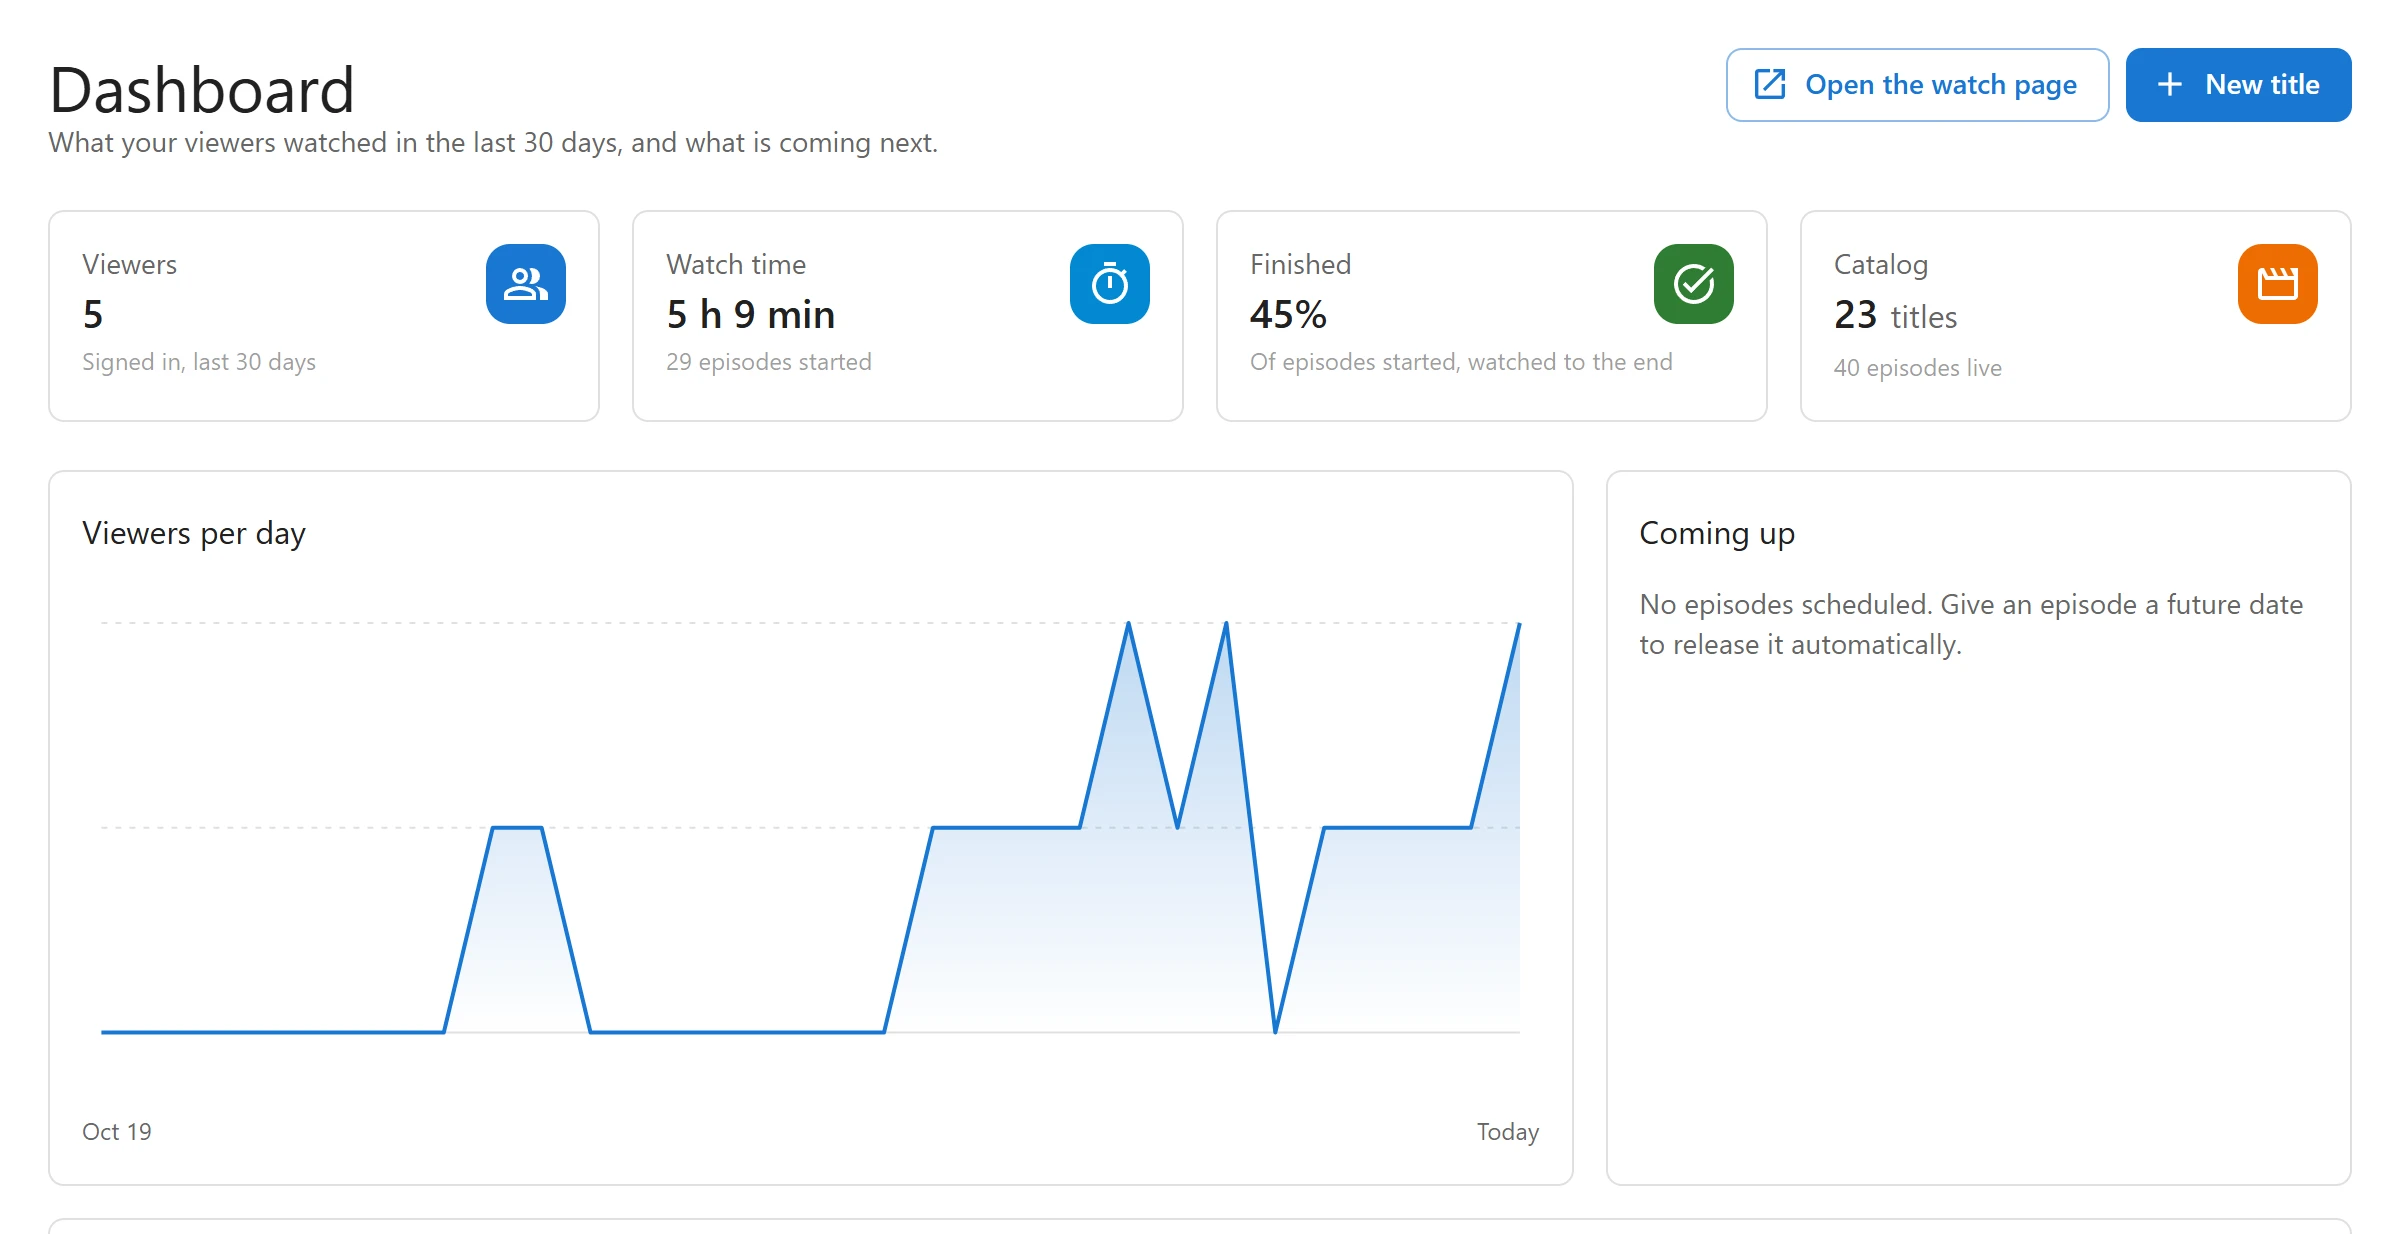
Two buttons sit at the top: Open the watch page opens your Watch page in a new tab, and New title opens an empty series form.
Who counts as a viewer
Viewing figures come from the progress the plugin saves for signed-in viewers. Guests can watch free episodes and resume them, but their progress stays in their own browser, so they are not counted here. On a site where nobody signs in, the viewing cards stay empty and say so: “Nobody has watched anything yet. Viewing appears here once signed-in viewers start an episode.”
The four tiles
| Tile | What it shows |
|---|---|
| Viewers | How many signed-in viewers watched something in the last 30 days |
| Watch time | The time they spent watching, with the number of episodes started under it |
| Finished | Of the episodes started, the share watched to the end. 90% means nine in ten episodes opened were finished. |
| Catalog | Your published titles, with the number of episodes live under it. Click it to open the Series & movies list. |
Viewers per day
A chart of how many signed-in viewers watched on each of the last 30 days.
Coming up
The next 6 scheduled episodes, soonest first, each with its series, its number and when it goes out. The heading shows how many episodes are scheduled in all. Schedule an episode by giving it a Release at date in the future. See Episodes.
Most watched, last 30 days
Your 6 most watched titles, by number of viewers, shown as posters in a row like the viewer app’s home screen, each with its rank. Under each poster: its number of viewers and the share of its episodes started that were finished. All titles opens the Series & movies list.
Where viewers stop
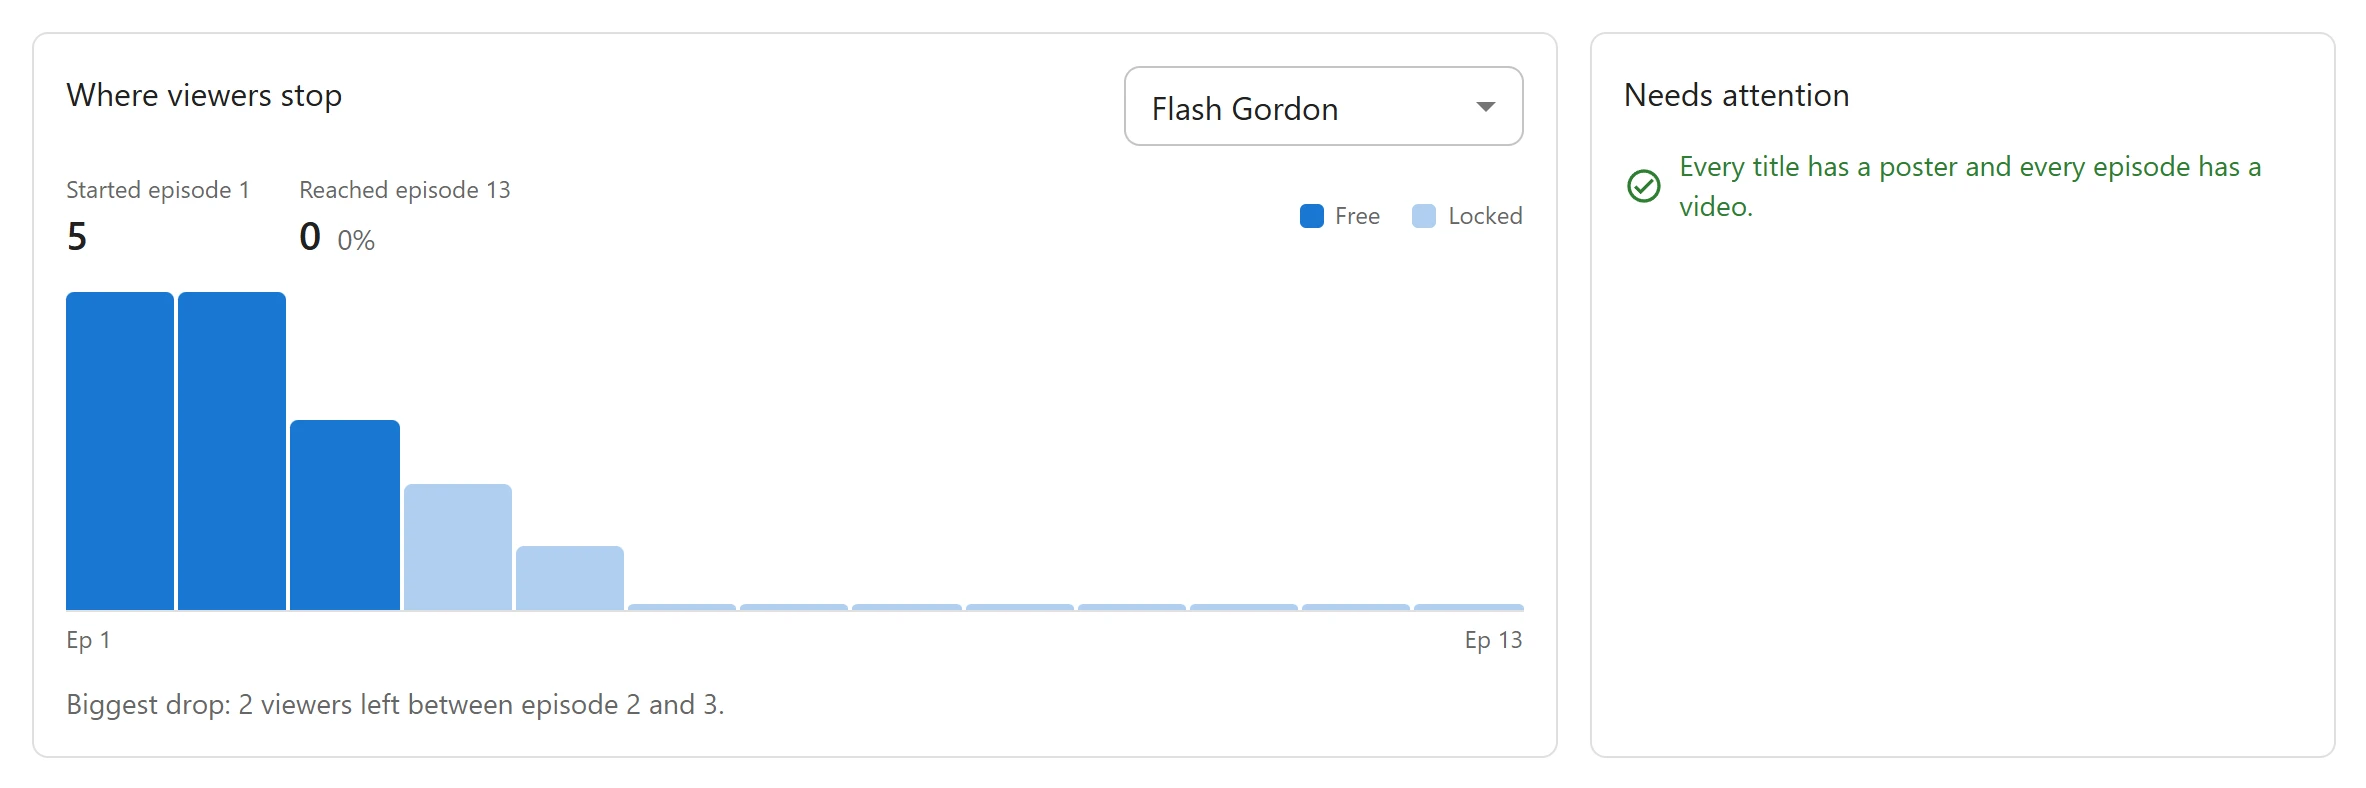
For the most watched series, a bar chart of how many viewers started each episode in the last 30 days. It shows where an audience falls away, episode by episode. Movies are not included.
- Started episode 1 and Reached episode give the first and last figures.
- Free episodes are drawn in full colour and locked ones lighter, with a Free and Locked legend. Hover a bar for the episode and its viewers.
- When several series have data, pick one from the menu at the top right of the card.
- Under the chart, a line names the biggest drop, such as “Biggest drop: 40 viewers left between episode 3 and 4”. When that drop is exactly where free episodes end and locked ones begin, the line says so: that is where viewers decide whether to pay.
To change where the free episodes end, see Free and locked episodes.
Needs attention
Problems a viewer would trip over, each with the first titles affected as links to open them:
| Line | What it means |
|---|---|
| Episodes without a video | Episodes with no source chosen yet. They cannot play. |
| Published with no episode live | A published title with no published episode, so its page has nothing to watch |
| Titles without a poster | Titles that show an empty tile in rows and lists |
When nothing is wrong, the card says “Every title has a poster and every episode has a video.”
Revenue
With Pro, a Revenue card PRO is added at the bottom of the Dashboard:
| Figure | What it shows |
|---|---|
| Today, Last 7 days, Last 30 days | Money taken in each period |
| Active VIPs | Viewers with an active VIP plan |
| Episodes unlocked (30 days) | Episodes unlocked with coins, one by one or with a whole series |
| Coins spent (30 days) | Coins viewers spent on unlocks |
See Orders and viewers and Coins and unlocks.
In the free plugin, a Get more from Plugixa Stream card at the bottom of the Dashboard lists what Pro adds. Click its cross to hide it: it stays hidden in that browser.
Quick Links
Share