

Contents
Analytics - Plugixa Exam
A score tells you how somebody did. Analytics tells you how your questions did.
Item analysis
Two numbers per question, answering different things.
| Measure | What it says | How to read it |
|---|---|---|
| Difficulty | What proportion answered it correctly | Very high or very low means it separates nobody |
| Discrimination | Whether strong candidates got it right more often than weak ones | Low or negative is the alarm |
Negative discrimination is the finding worth acting on. It means the candidates who did best on the paper overall did worse on this one question, which almost always means the wording is ambiguous, the answer key is wrong, or the question misleads the people who read most carefully.
A hard question is fine. A question that punishes your best candidates is a bug.
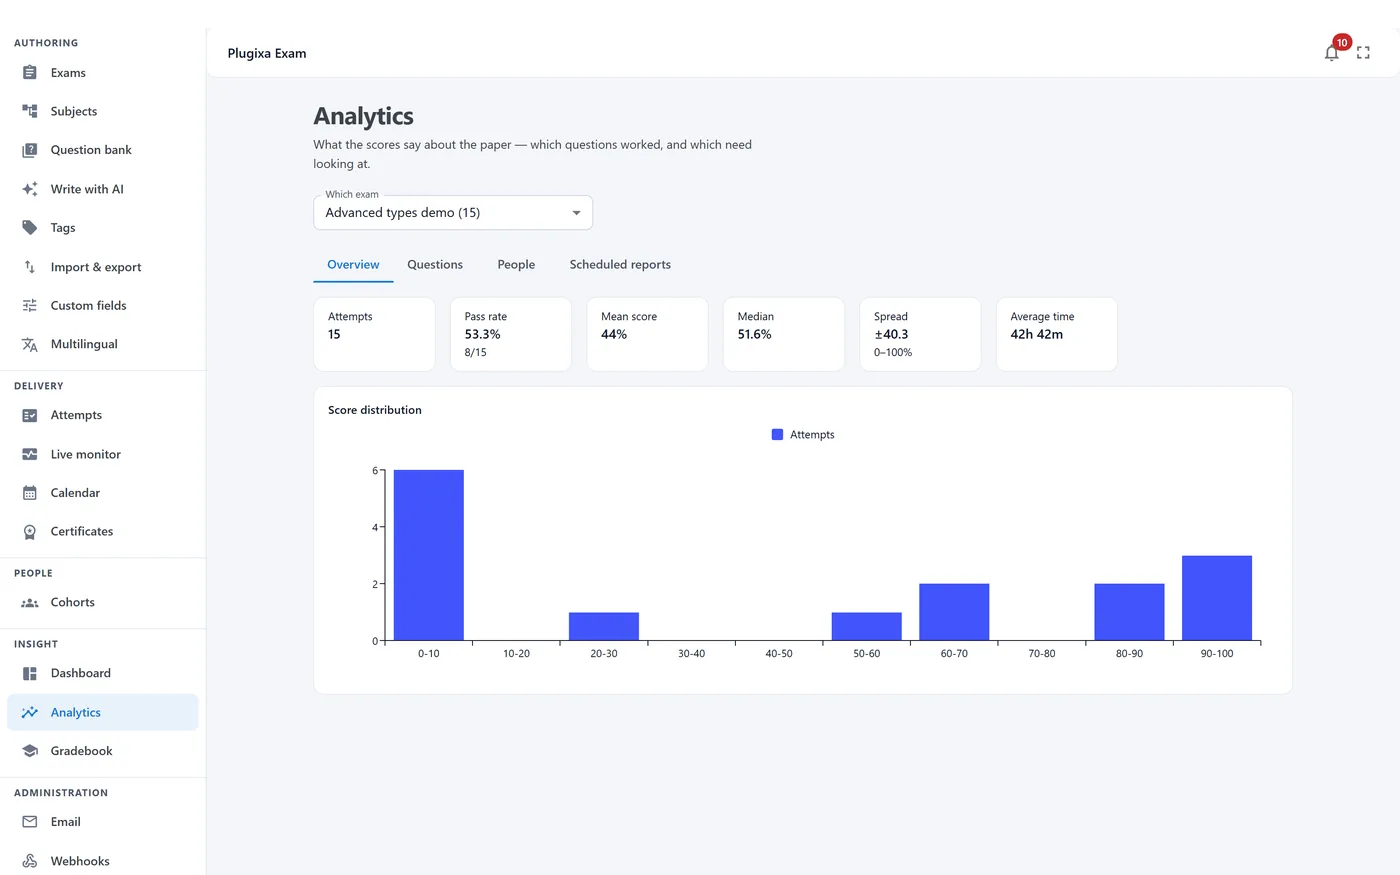
Score distribution
The shape of a cohort’s marks. Two humps usually means two populations sat the paper - prepared and unprepared, or two different classes. A ceiling means the paper was too easy to tell anybody apart.
Per-student trends
Every attempt somebody has made, over time, so improvement or its absence is visible without exporting anything.
Export and scheduled reports
Filtered attempts and analytics export to CSV.
Scheduled reports email the digest on a schedule, as HTML, so the numbers arrive rather than waiting to be looked at. Its template sits with the others in Notifications - it is the sixth one, contributed by this module rather than seeded on activation.
Troubleshooting
| Symptom | Usual cause |
|---|---|
| Item analysis is empty | Too few attempts. The statistics need a cohort, not a handful. |
| Discrimination is negative on several questions | Read them properly: it is usually one ambiguous option or a wrong key. |
| A scheduled report never arrives | WP-Cron is not running. Check that before looking here. |
| Numbers differ from the result pages | Analytics counts marked, released attempts. A paper waiting on a marker is not in it yet. |
What to do next
- Fix what the analysis found in Questions.
- Watch the next sitting live with Live Monitoring.
- Turn percentages into bands with Gradebook.