

Contents
Dashboard - Plugixa Exam
The first screen under Exams, and the one worth glancing at rather than reading.
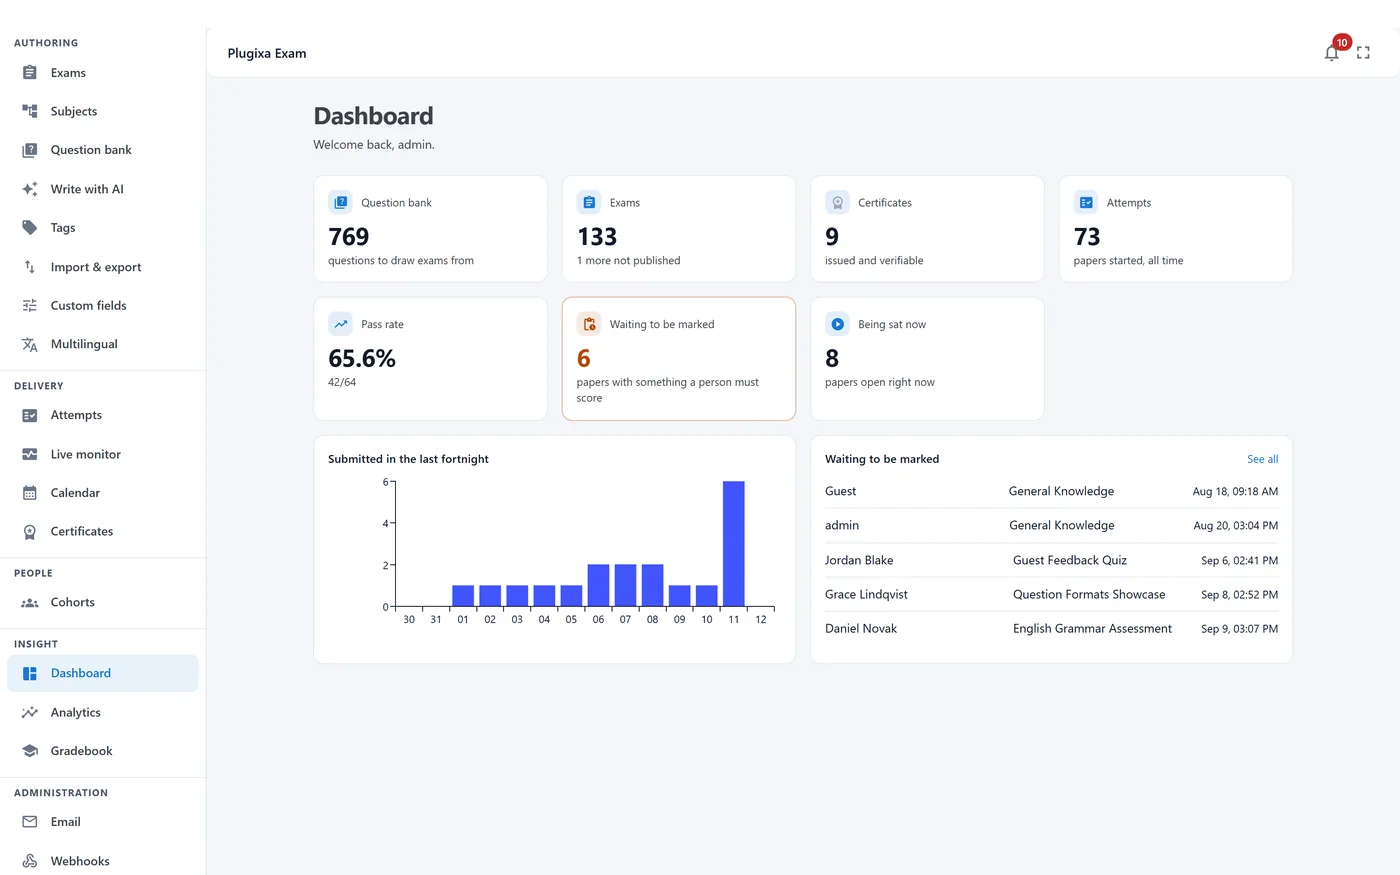
The tiles
| Tile | What it counts |
|---|---|
| Question bank | Questions available to draw exams from |
| Exams | Published, with unpublished noted underneath |
| Certificates | Issued and verifiable |
| Attempts | Papers started, all time |
| Pass rate | Across marked attempts, with the fraction it came from |
| Waiting to be marked | Papers with something a person must score |
| Being sat now | Papers open at this moment |
The two that need acting on
Waiting to be marked is the working number. It links straight into the attempts list filtered to the marking queue, which is the fastest route from “is there anything to do” to doing it. See Manual Marking.
Being sat now is the one to notice during a scheduled sitting. If it is higher than it should be an hour later, some of those attempts have been abandoned rather than submitted, and the inactivity sweep has not reached them yet. See Exam Runner.
Below the tiles
Submitted in the last fortnight as a bar chart, so an unusual day stands out, and Waiting to be marked as a list of the oldest papers with who sat what and when.
What it does not tell you
Nothing about question quality. A healthy pass rate is compatible with several badly written questions cancelling each other out, which is what Analytics PRO is for.
Troubleshooting
| Symptom | Usual cause |
|---|---|
| Tiles are empty on a new install | Nothing has been created or sat yet. The Pro demo dataset fills every screen if you want to look around first. |
| The pass rate looks wrong | It counts marked attempts only. Papers waiting on a marker are not in it. |
| “Being sat now” never falls | Attempts are being abandoned and the sweep has not closed them. Check the exam’s inactivity timeout. |
| The certificates tile is missing | Certificates are off in the App Manager, or the role cannot read them. |
What to do next
- Start building in Getting Started.
- Clear the queue in Manual Marking.
- Fill every screen with the Demo Data PRO set.