

Contents
On this page
Dashboard - Plugixa POS for WooCommerce
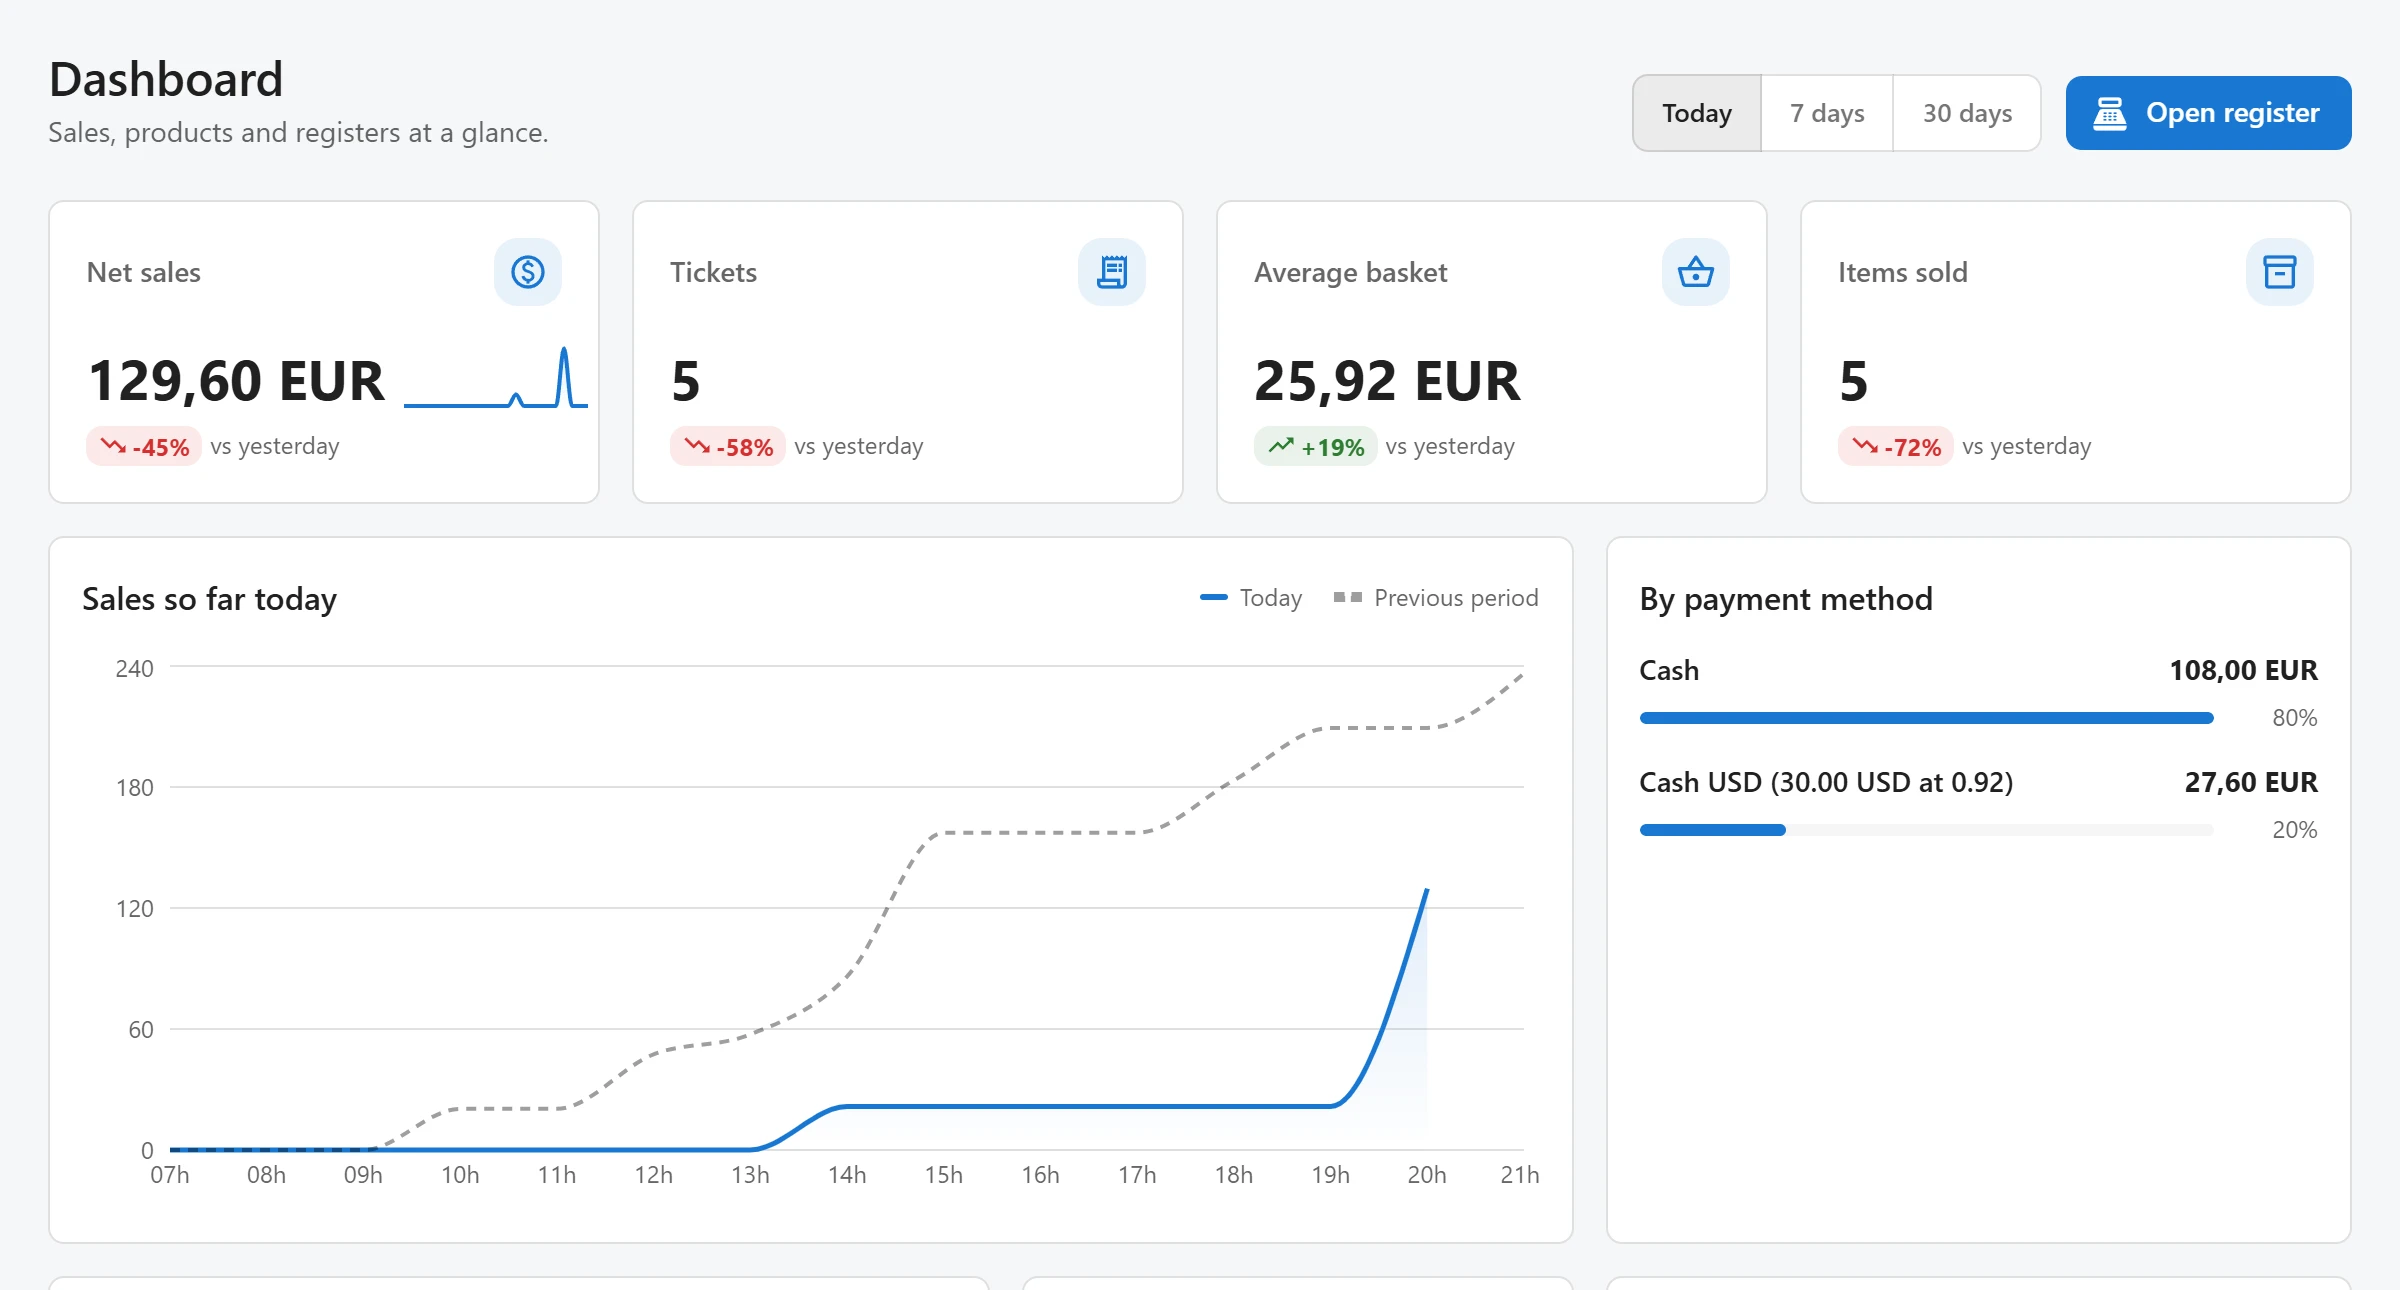
The Dashboard is the first screen of the back office. It shows how the registers are selling today, over the last 7 days or over the last 30 days, compared with the period just before, and which registers are open right now.
Open Plugixa POS > Dashboard in WordPress. The screen needs the view reports
permission (plugixa_pos_view_reports); administrators have it. See
Staff access.
Where the figures come from
Every figure on the Dashboard is read from the fiscal journal, the record each register writes for every sale and refund. That has two consequences:
- Only register sales count. Orders placed in your online shop are not on the Dashboard; see them in WooCommerce.
- A figure cannot drift from your Z reports, because both read the same records.
Amounts include tax. Days and hours follow your WordPress time zone (Settings > General). The screen refreshes itself every minute while it is open.
Choosing the period
The buttons at the top right switch the period:
| Button | Period | Compared with |
|---|---|---|
| Today | Since midnight | Yesterday |
| 7 days | Today and the 6 days before | The 7 days before that |
| 30 days | Today and the 29 days before | The 30 days before that |
Open register opens the register (/pos) in a new tab.
The four tiles
| Tile | What it shows |
|---|---|
| Net sales | Sales minus refunds in the period. When there were refunds, their total shows under the figure. A small curve shows the period day by day (hour by hour for Today). Click the tile to open Orders. |
| Tickets | The number of sales. Click the tile to open Orders. |
| Average basket | Sales divided by the number of tickets. Refunds do not lower it. |
| Items sold | The number of items sold in the period, less the items refunded. |
Under each figure, a badge shows the change against the previous period, as a percentage with an arrow, followed by vs yesterday, vs previous 7 days or vs previous 30 days. When the previous period had no sales at all, the tile says so instead, for example No sales yesterday.
Charts and lists
Sales so far today (Sales for 7 or 30 days) draws the net sales of the period as a solid line and the previous period as a dashed line. For Today it is a running total by hour, from 7:00 to 21:00, that stops at the current hour, so you can see whether you are ahead of yesterday.
By payment method lists the money taken per method (Cash, Card (terminal) and any method Pro adds), largest first, with each method’s share of the total.
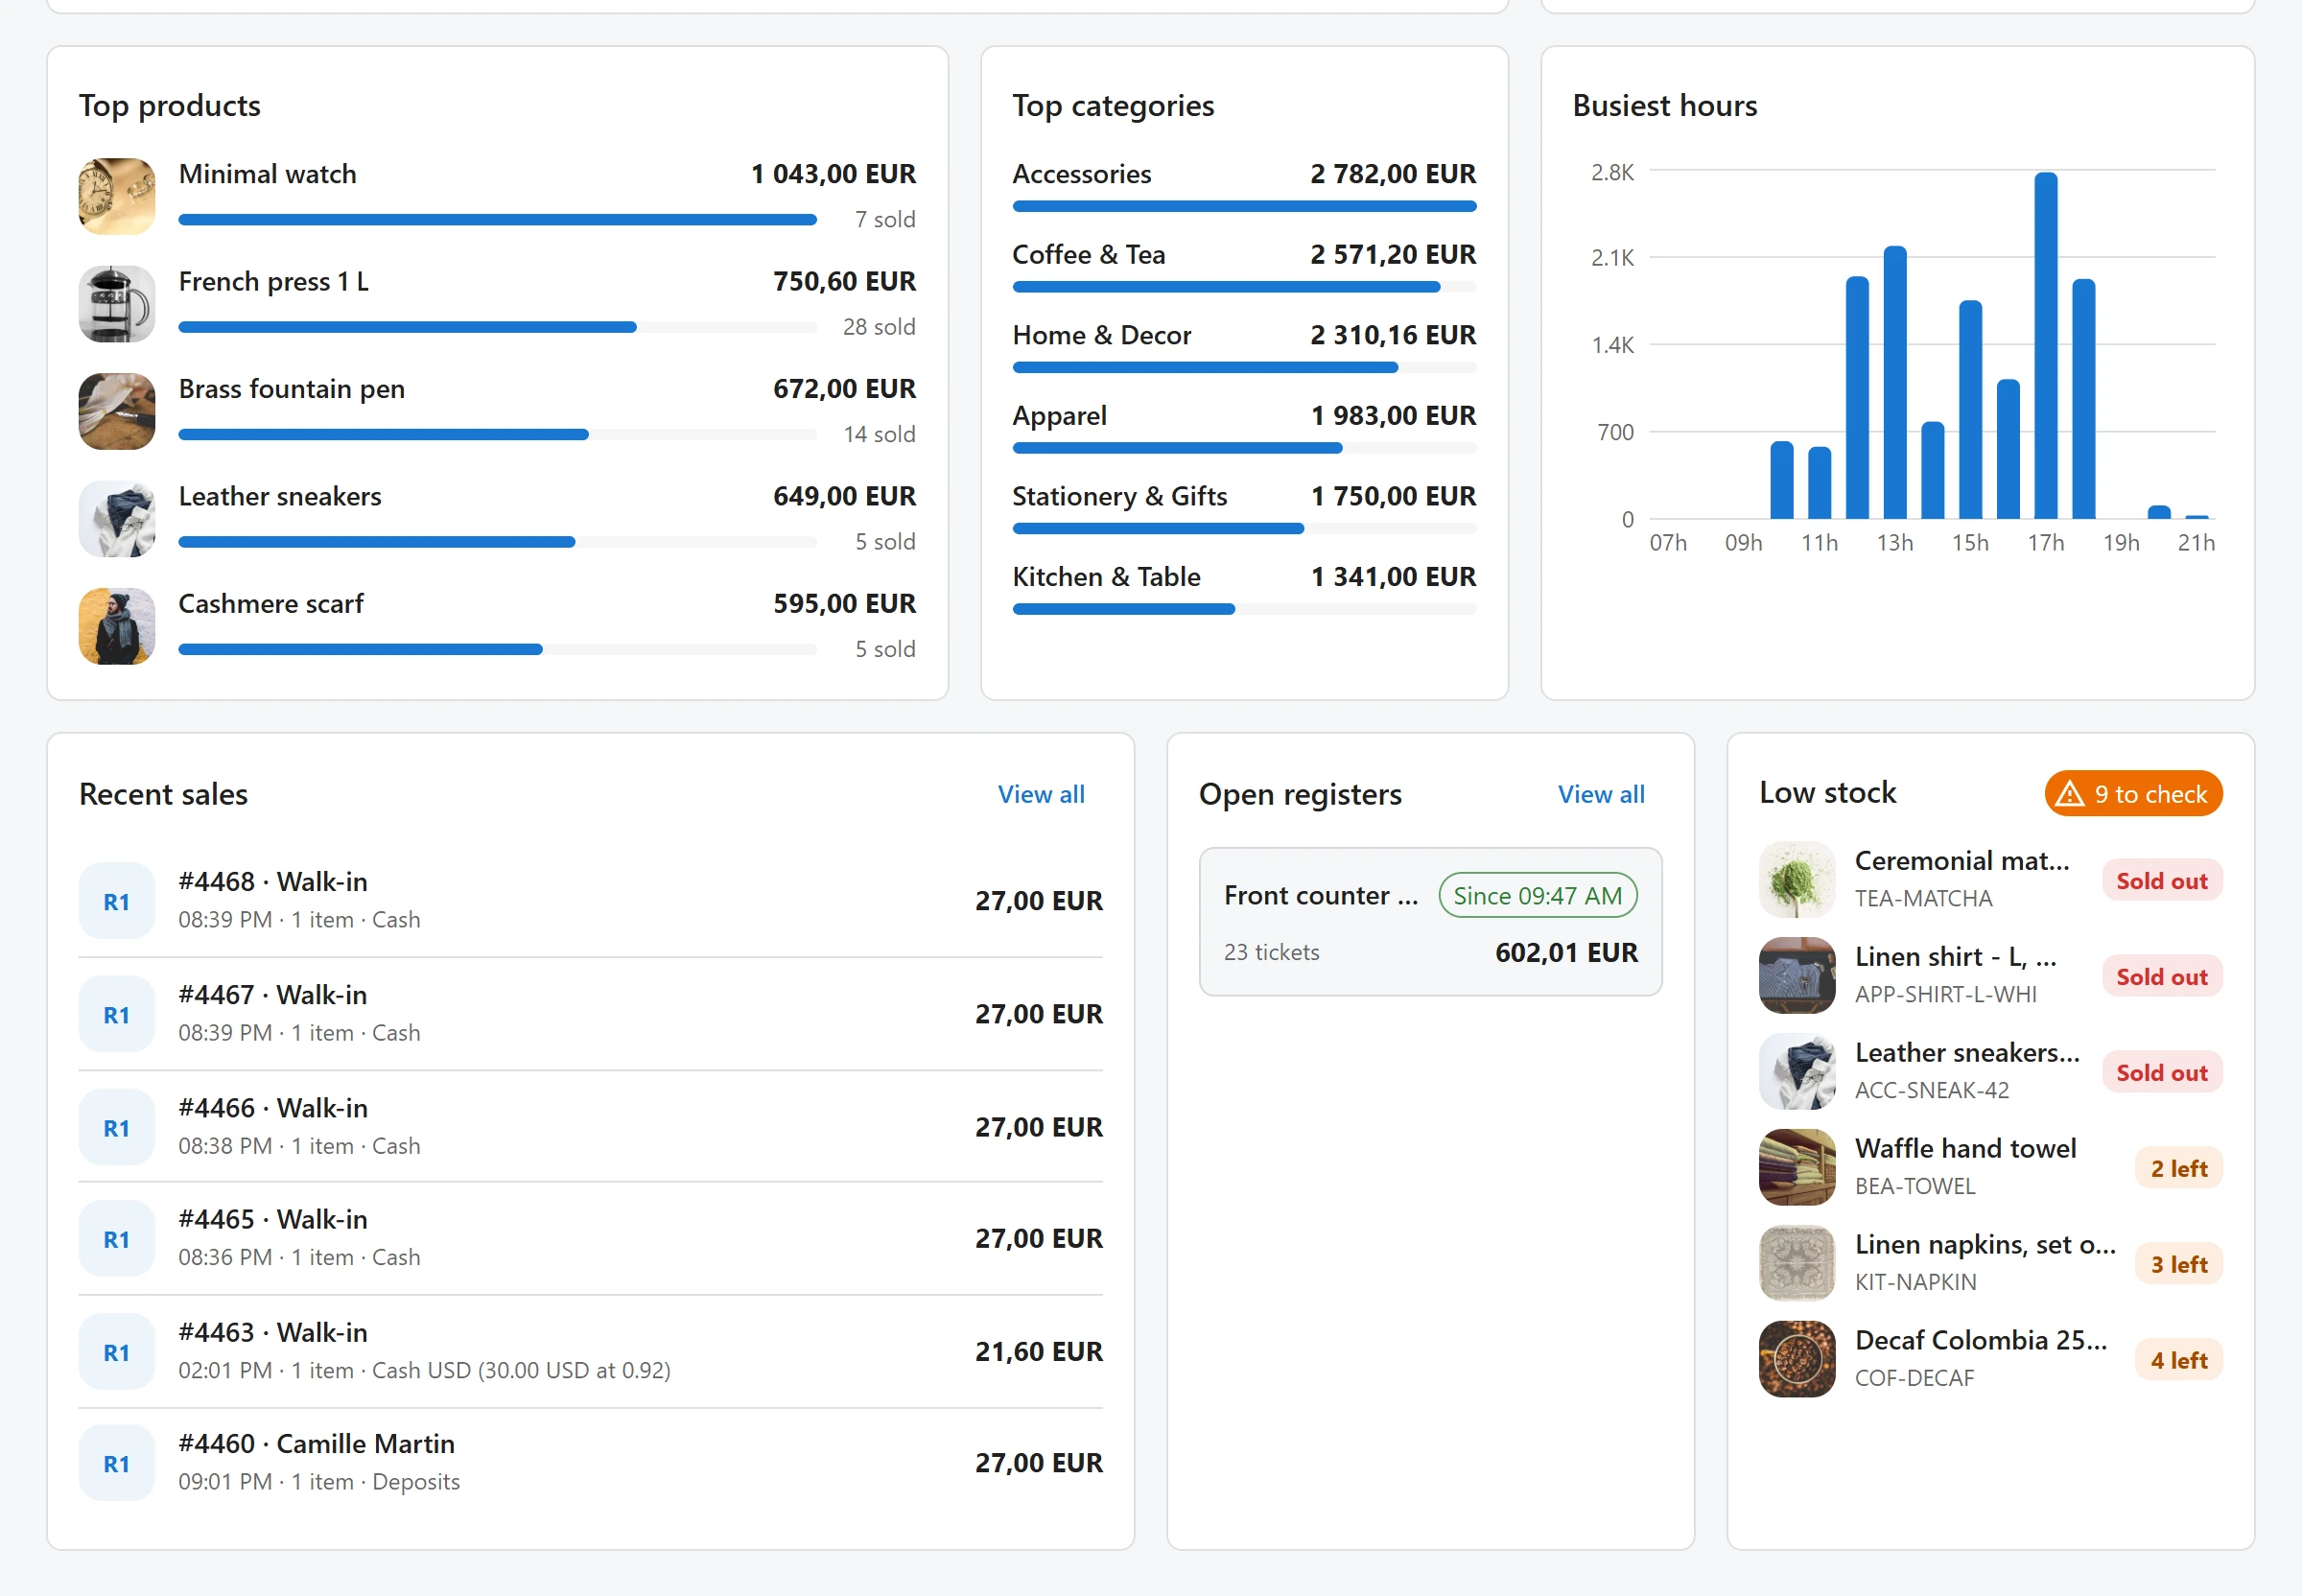
Top products shows the five products that brought in the most in the period, with their photo, the amount and how many were sold, refunds deducted. Variations count under their product.
Top categories shows up to six top-level product categories by amount. A product in two categories counts in both, and a sub category counts in its top-level parent.
Busiest hours shows net sales per hour of the day, from 7:00 to 21:00, for the whole period.
Recent sales, open registers and low stock
These three cards do not change with the period.
Recent sales lists the last six sales on any register: the register code (for example R1),
the order number, the customer (or Walk-in), the time, the number of items, the payment
method (Split payment when there was more than one) and the total. View all opens Orders.
Open registers lists each register with an open cash session: its name and code, Since and the time it was opened, the number of tickets and what it has taken so far. When every register is closed, the card says All registers are closed. View all opens Cash sessions.
Low stock lists published products and variations that track stock and have 5 or fewer in stock, lowest first. Up to six are shown, each with its SKU and n left or Sold out; the chip at the top gives how many there are in all. Click a product to edit it in WooCommerce. When nothing is low, the card says Nothing is running low.
In the free plugin
The free plugin shows one card under the widgets that presents Pro. Its cross hides it for good in that browser. With Pro, more detailed reports by store, register and cashier are on Reports PRO.
Quick Links
Share