

Contents
On this page
Reports - Plugixa POS for WooCommerce
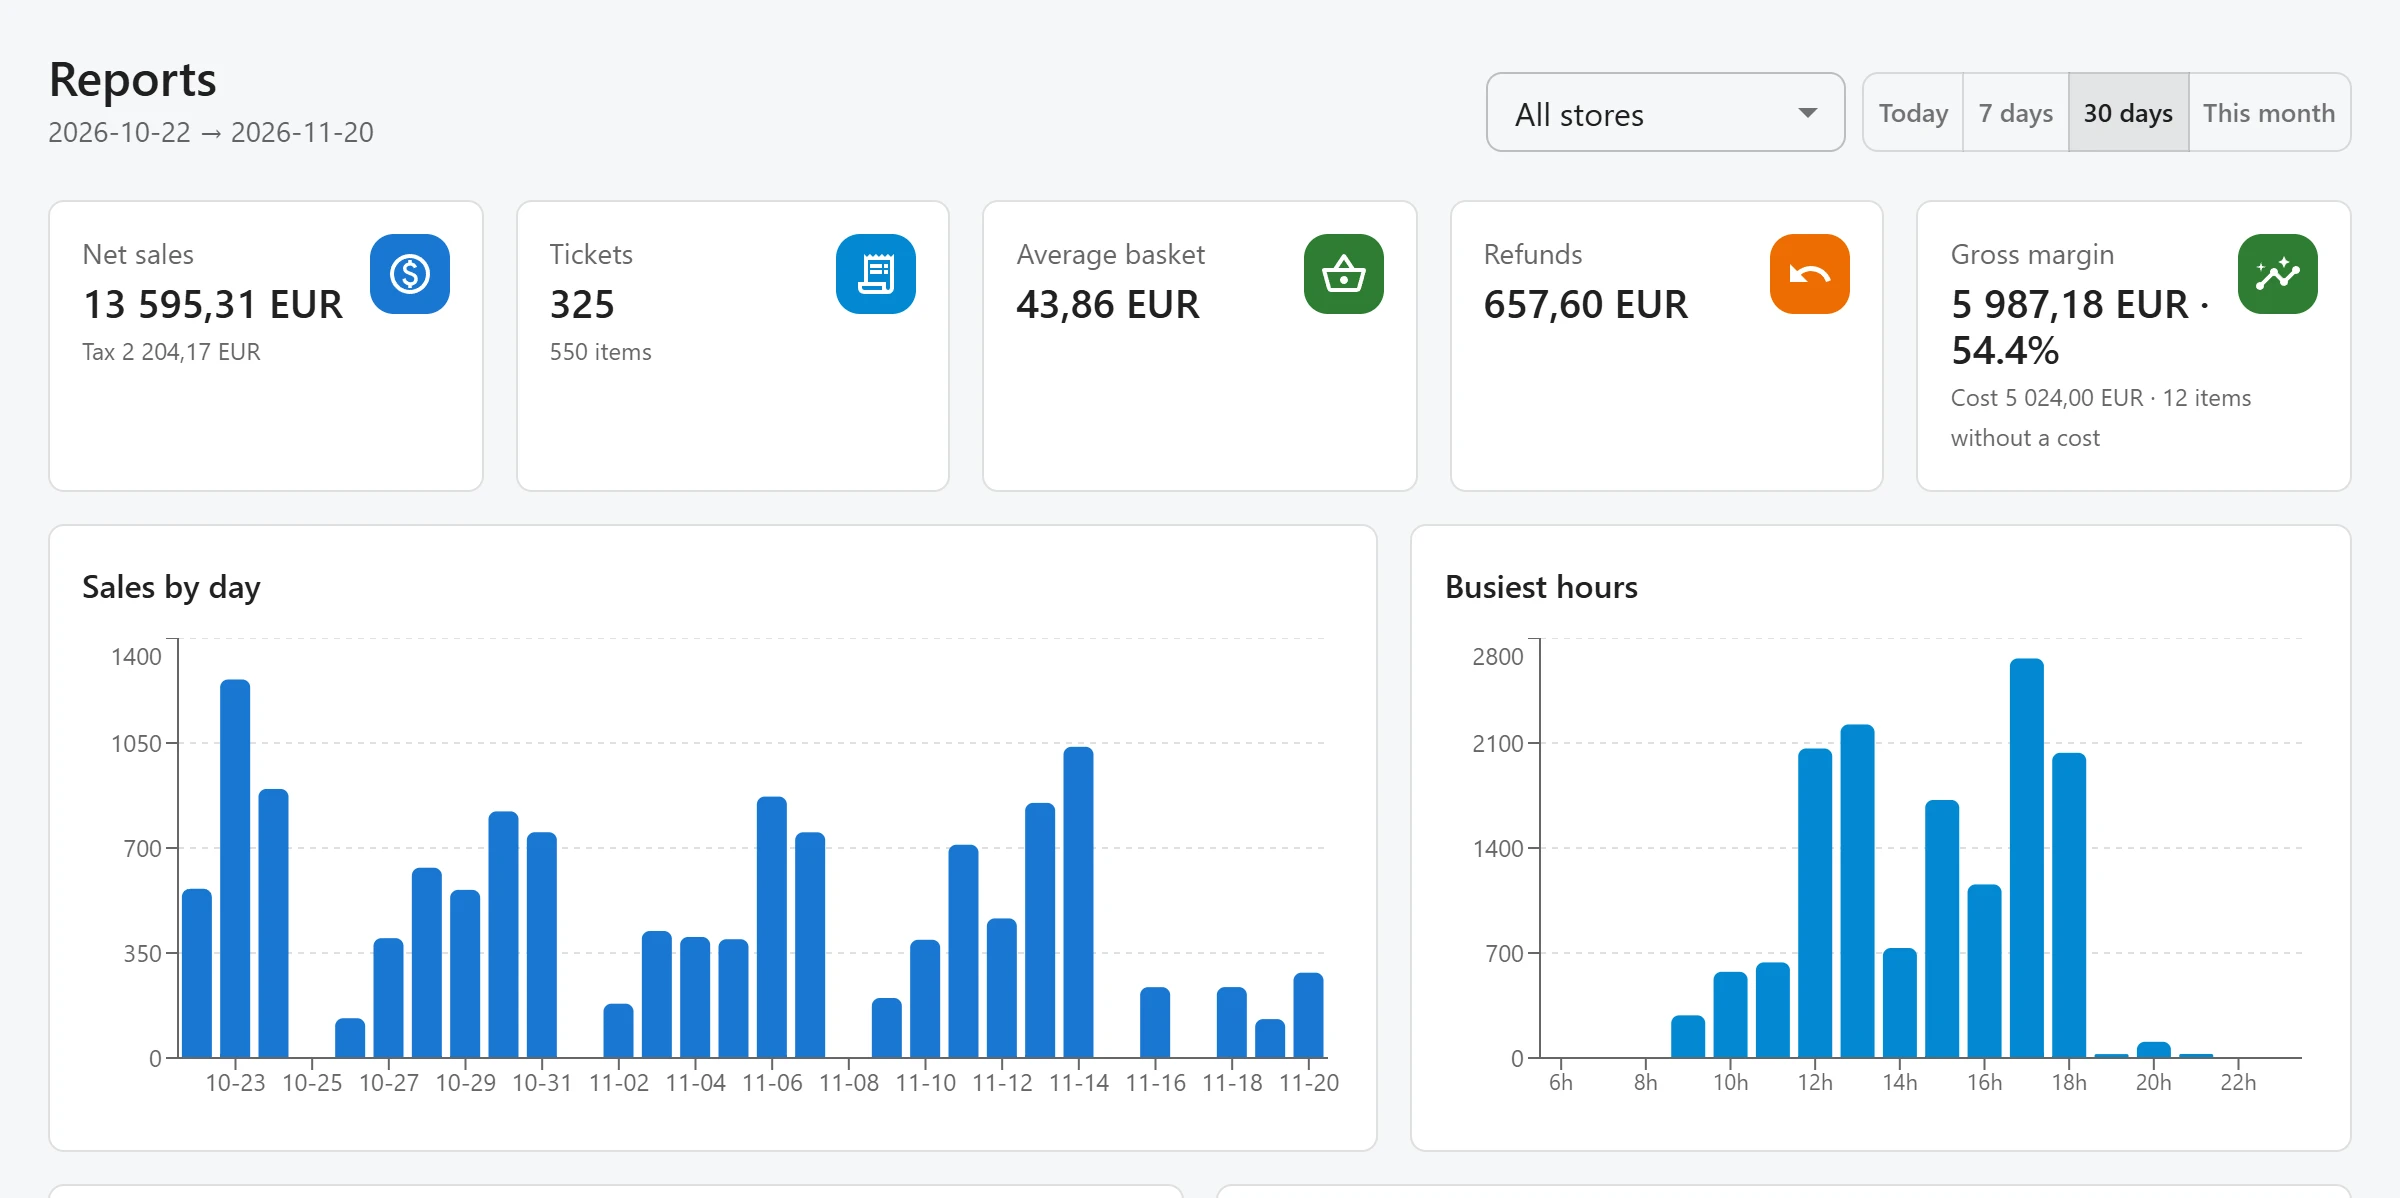
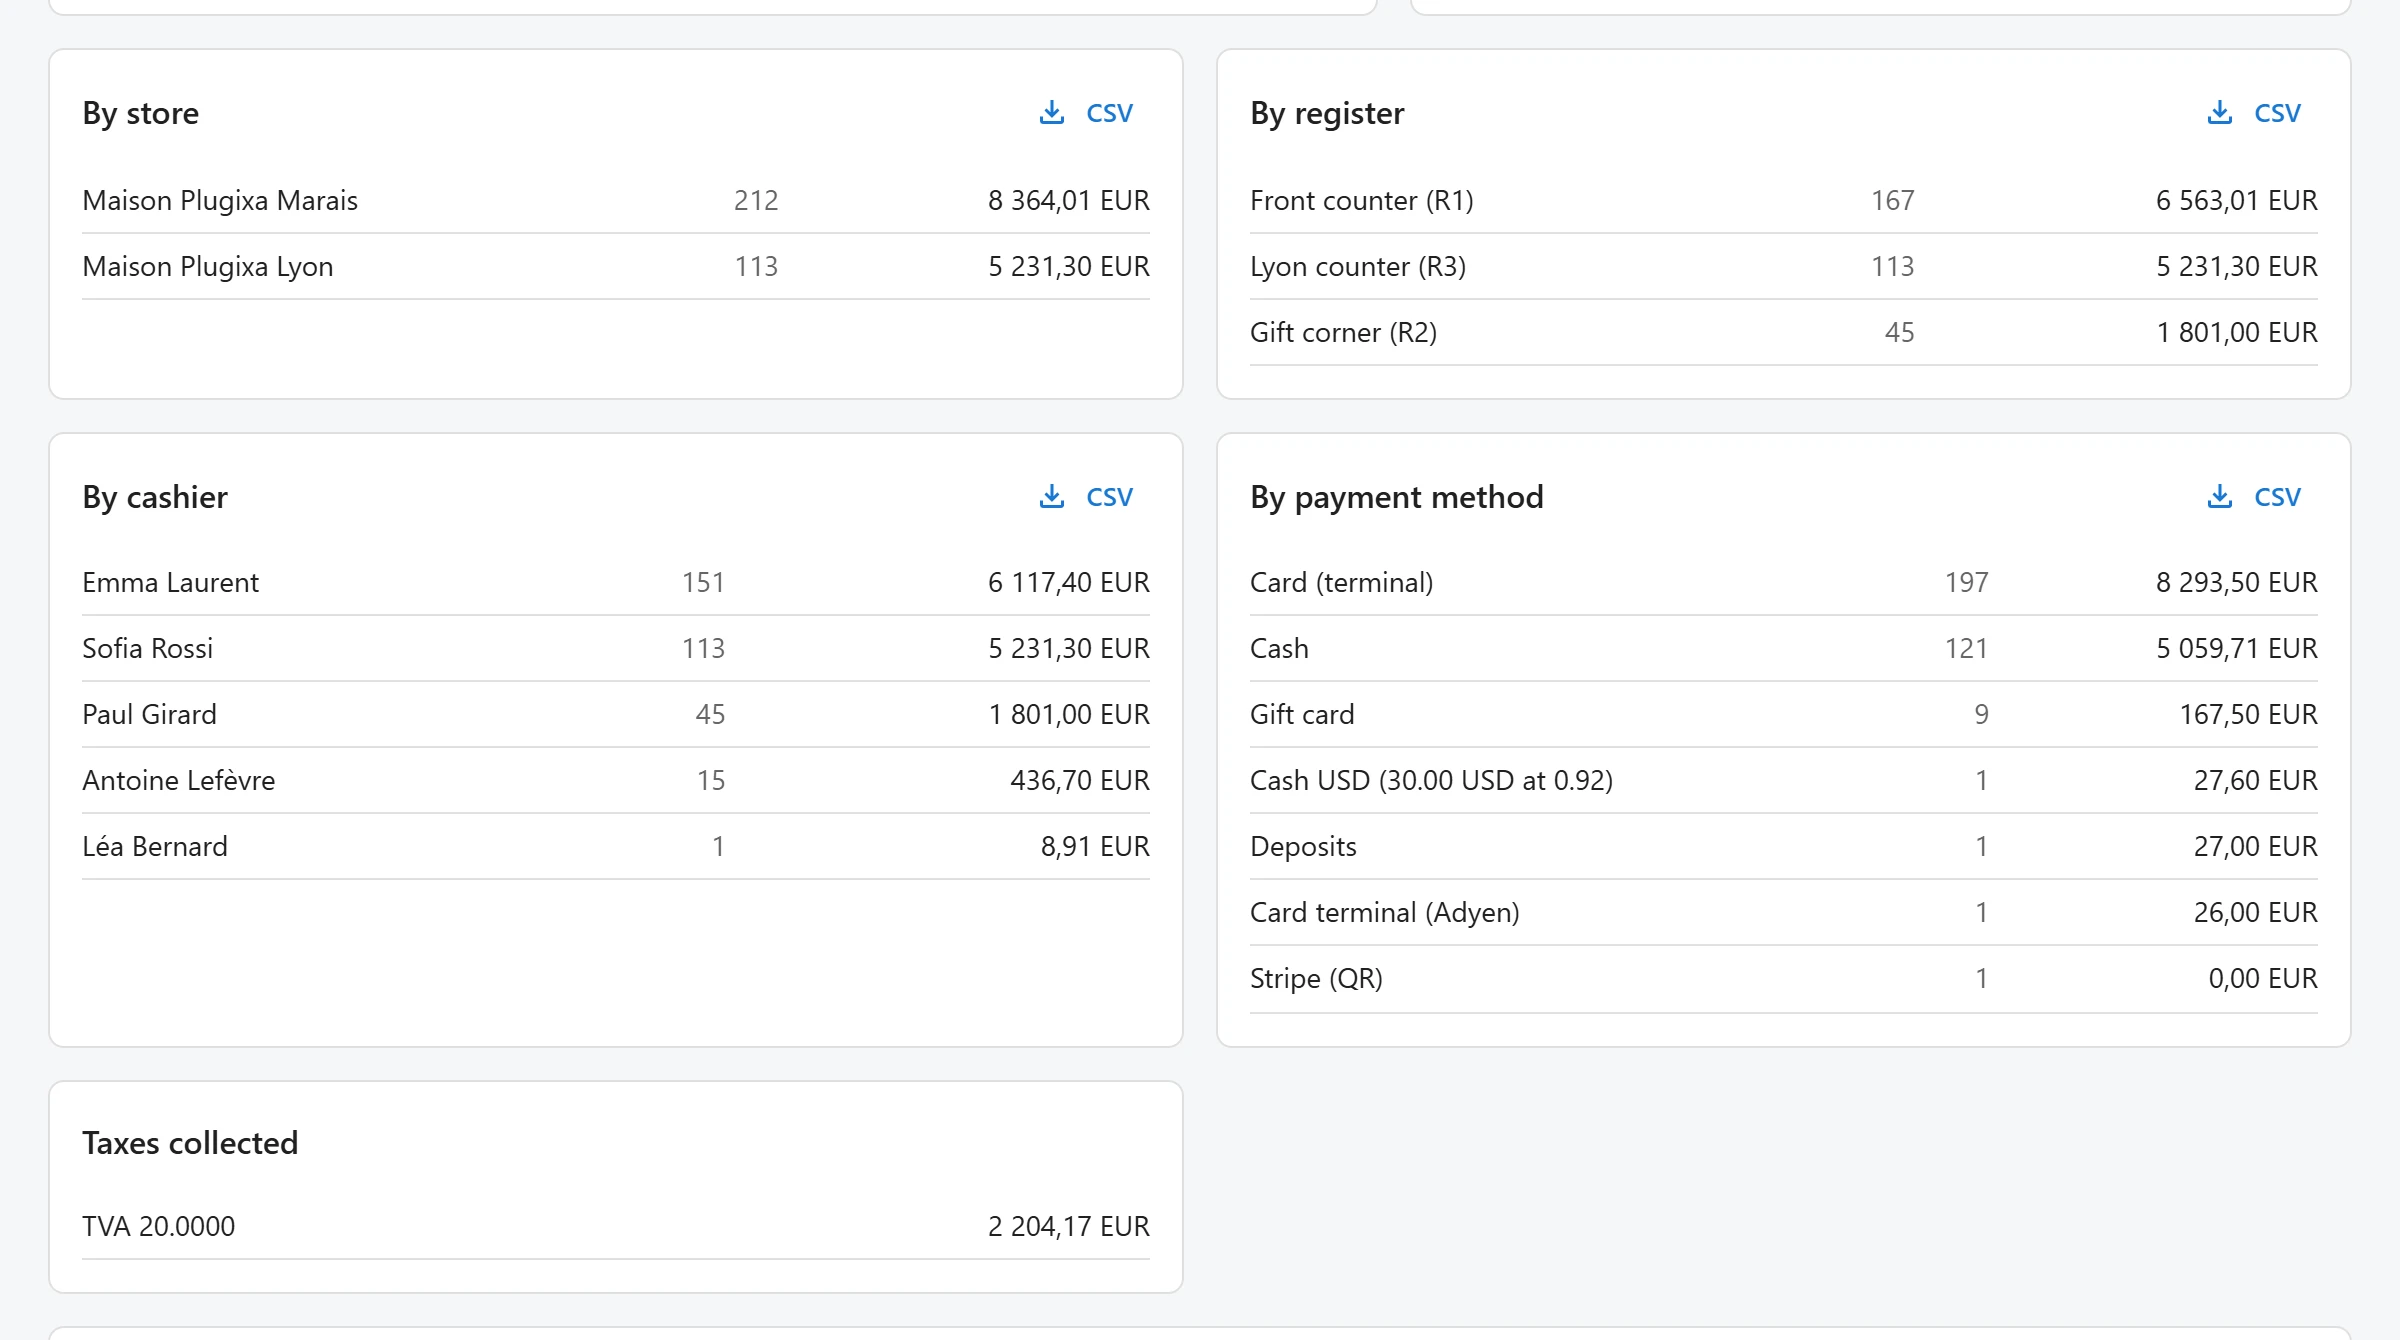
Reports shows how your registers sell over a period: totals, margin, busy days and hours, and breakdowns by store, register, cashier, payment method and tax. Each breakdown downloads as a CSV file for your spreadsheet or your accountant.
Open Plugixa POS > Reports. It needs the right to view reports (administrators out of the box, see Staff access).
Where the figures come from
Every figure is computed from the fiscal journal: the sales and refunds written there by the registers. The reports therefore match your Z reports, and an order edited later in WooCommerce does not change them. Online orders that never went through a register are not part of the report.
Dates are your site’s calendar days.
Choose the period and the store
At the top right:
- the store list: All stores, or one store,
- the period: Today, 7 days, 30 days or This month.
7 days and 30 days end today. The chosen dates show under the title.
The tiles
| Tile | What it shows |
|---|---|
| Net sales | Sales minus refunds over the period. The tax is shown underneath. |
| Tickets | The number of sales, with the number of items underneath. |
| Average basket | Sales divided by the number of tickets. |
| Refunds | The total refunded in the period. |
| Gross margin | Line amounts without tax, minus their cost, with the margin percent. Underneath: the Cost, and how many items without a cost were left out. |
The margin uses the cost copied onto each order line at the moment of the sale (see Purchasing). Items sold without a known cost are left out of the margin and counted apart, so the percent is the margin of the sales whose cost you know. Give your products a cost under Purchasing > Product costs to make the margin complete.
The charts
- Sales by day: net sales for every day of the period, quiet days included.
- Busiest hours: net sales by hour of the day, from 6h to 23h.
The breakdowns
| Card | One row per |
|---|---|
| By store | Store |
| By register | Register, with its code |
| By cashier | Person who rang up the sale or the refund |
| By payment method | Payment method, by the amount taken |
| Taxes collected | Tax rate, with the amount |
Each card’s CSV button downloads it (sales-by-store.csv, sales-by-register.csv,
sales-by-cashier.csv, sales-by-payment.csv) with the columns Net and Tickets.
A refund counts against the store, register and cashier that made the refund, on the day of the refund. (The staff performance report counts it against the original seller instead.)
Top products
The Top products table lists the 50 products with the highest net sales: Product, SKU,
Quantity, Net sales (without tax), Cost and Margin. Cost and margin stay empty for a product
without a known cost. CSV downloads the table as top-products.csv.
Limits
| Message | Why |
|---|---|
| “The start date must be before the end date.” | The period is reversed. |
| “Choose a period of at most 400 days.” | The period is too long. |
The presets on the screen always stay within these limits; the messages matter if you call the report through the REST API.
Related reports
- Staff performance: sales and commission per cashier, see Staff, PINs and commission.
- The free Dashboard shows today’s figures.
- Stock adjustments values your stock losses at cost.
Quick Links
Share